 Video Courses
 Video Courses
Disclaimer: This is a ‘pop’ article. It contains the personal views of the author and is designed to generate discussion only. It is not endorsed by any clinical body and should not guide clinical practice.
There is currently interest in the application of ECG screening to young sports people. Getting an ECG is easy, reading them in the young is challenging. Consider the ECG shown below. It is taken from a schoolboy aged 16 years. He plays multiple contact sports and trains regularly. His mother is concerned about a lack of energy obvious in several recent matches. He has no complaints. There is no significant family history. On examination, he is 6′ tall and weighs 145 pounds. Cardiovascular examination is completely normal.
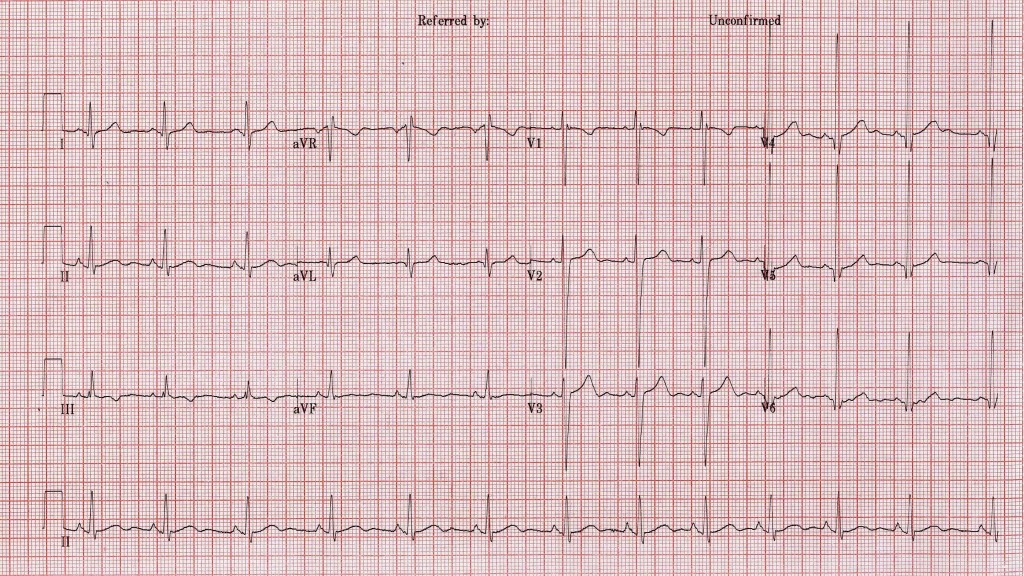
As indicated by the reviewing doctor below, his ECG is strikingly different from those we are used to looking at in clinical practice but is it any cause for concern? Will he be able to play next Saturday?
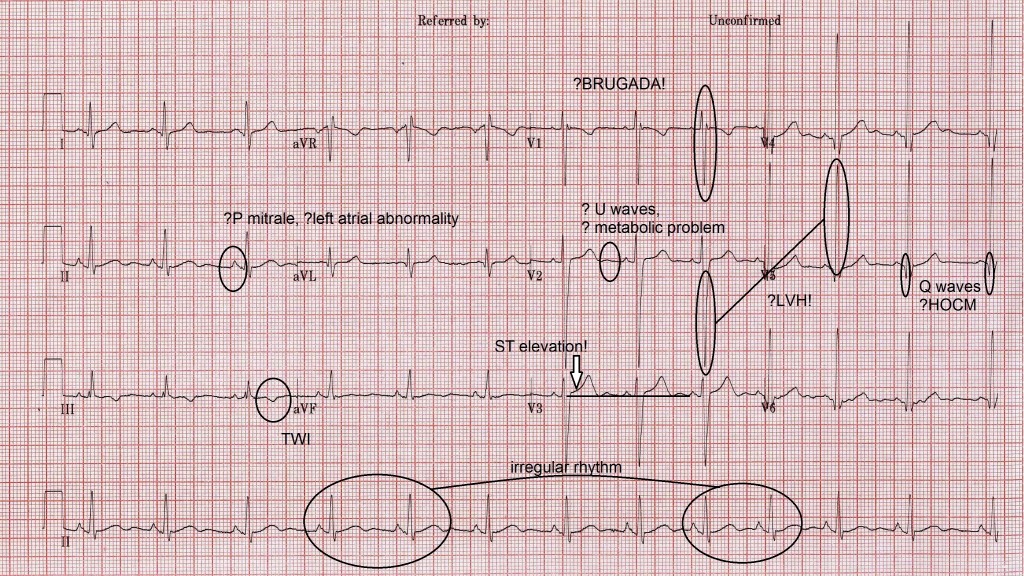
The answers to these questions are no and yes (if selected). When analyzing the ECG of young men, particularly those who are physically trained we must keep 5 (maybe 6) things in mind
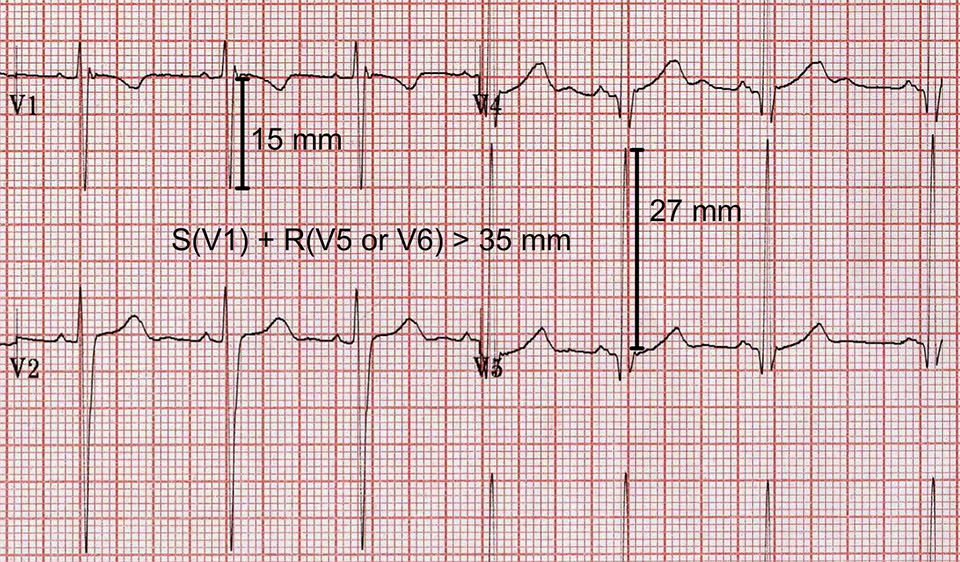
In general terms, the height of the R waves in the left lateral chest leads and the depth of the S waves in the right sided chest leads correlate with the muscle mass of the left ventricle. The criteria (Sokolow-Lyon criterion) for pathological ventricular hypertrophy were established in post-mortem comparisons of heart size to ante-mortem ECGs. The criteria are reasonably specific and have been validated in the old and middle aged subjects in recent years using cardiac MRI. There is some doubt, however, as to whether these criteria are in any way applicable to the young.
The young mans ECG easily satisfies the published criteria for left ventricular hypertrophy (see below). He probably does have a degree of left ventricular hypertrophy but this is expected as a normal consequence of regular training. When considered in clinical context, the R waves and S waves on his ECG are normal.
The perceived risk here is that we could miss a case of hypertrophic obstructive cardiomyopathy (HOCM), a condition associated with left ventricular hypertrophy and sudden death. However, the great majority of HOCM cases will demonstrate ST changes and/or pathological deviation of the cardiac axis in association with the R and S wave changes of hypertrophy. ECG (A) below does not cause great concern in a young sportsman. In contrast, the same findings associated with widespread repolarization abnormalities (T wave inversion) in ECG (B) would be a cause for concern and would merit further investigation.
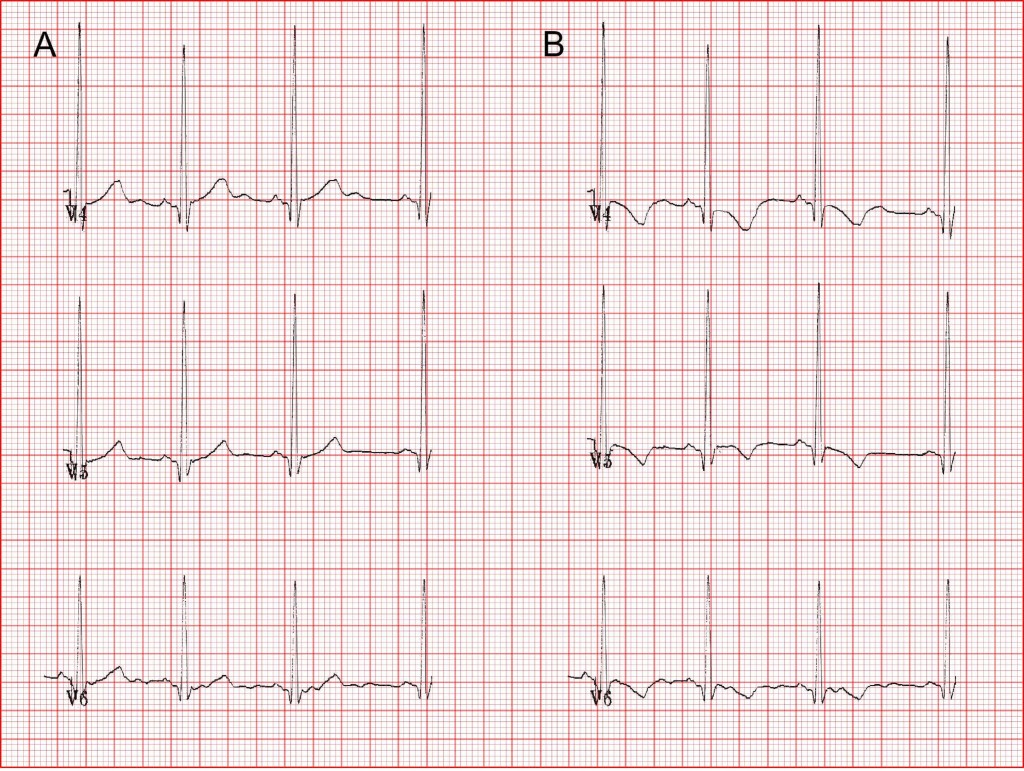
Tall R and deep S waves in isolation, are not an indication for further investigation in a young person.
On the ECG under consideration, there is a marked sinus arrhythmia. The arrhythmias present in very fit young people may be even more dramatic but equally benign. Benign conduction abnormalities, such as the Wenkebach phenomenon or first degree AV block, are common perhaps reflecting increased vagal tone in this group, carry no risk and may disappear during exercise.

The ECG under consideration demonstrates an incomplete right bundle branch block (RBBB) that is an rSr ‘pattern’ in lead V1 with a normal qrs duration (less than 0.12s, less than 3 small squares). This is a common normal variant on the resting ECG of young people, Also, in the young, T waves are normally inverted in V1 and V2 (the ‘juvenile T wave pattern’).
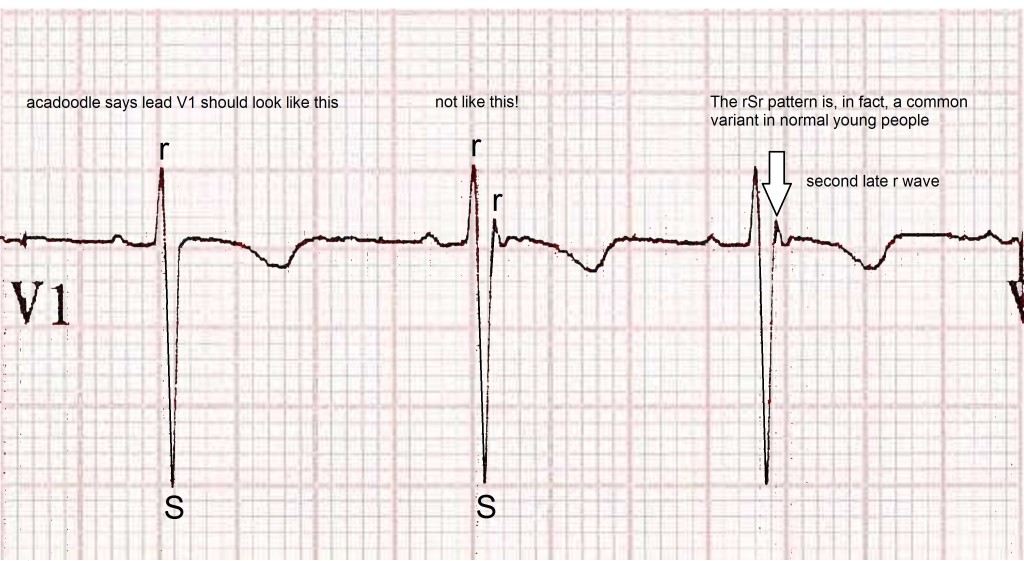
Complete RBBB (qrs duration > 0.12s) is also common in the young in the absence of heart disease. The evidence suggests that this has no clinical implications. The fear amongst most doctors here is that we might miss a case of the Brugada syndrome, a cause of sudden death in the young. However, the three subtypes of Brugada syndrome are associated with upright T waves and/or ST elevation in V1/V2.
Incomplete right bundle branch block is of no concern. In the absence of ST segment elevation in V1 and V2 and provided the T waves in these leads are negative, this is probably also true of complete RBBB. However,many experts would disagree with the latter statement advocating further investigation for any case associated with a prolonged qrs duration. It’s up to you.
U waves, bifid P waves, q waves and T wave inversion (TWI), are features of many a normal ECG. These features are present on our subjects ECG.
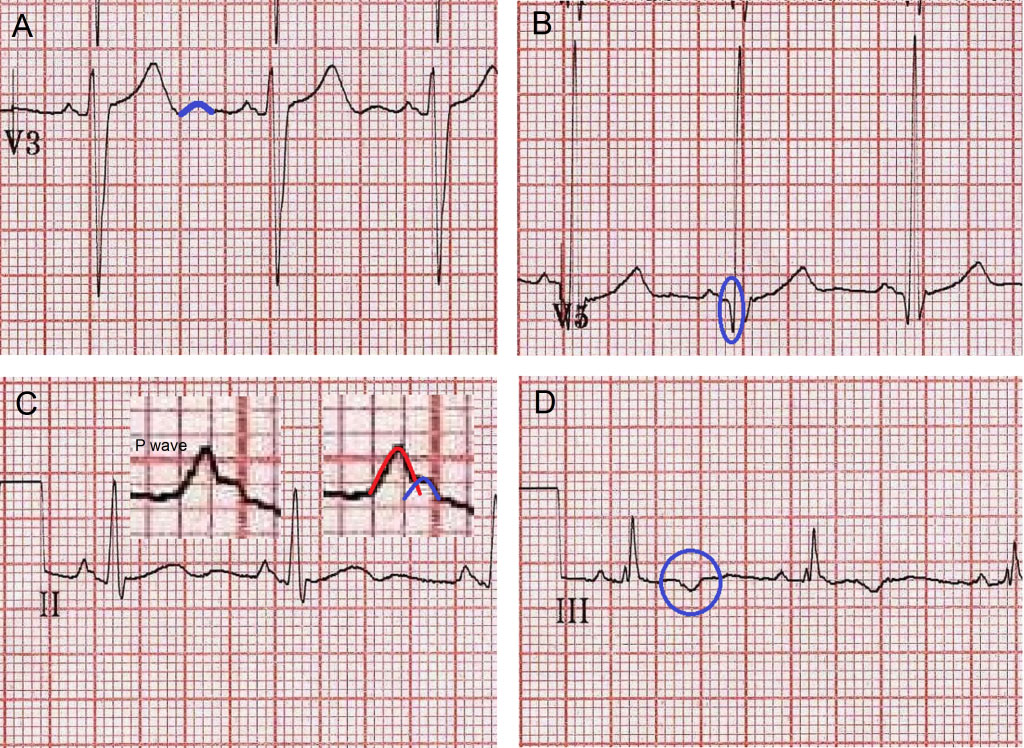
A. U waves (blue outline) are often seen on the normal ECG. They are probably produced by the normal process of Purkinje fibre repolarization. They may become exaggerated in the presence of hypokalemia but if you look, they are present on most ECGs even in the absence of metabolic derangement.
B. Physiological q waves (blue circle) are common on the ECG in the absence of heart disease. Pathological Q waves are a recognised feature of HOCM. The criteria for distinguishing physiological q waves from pathological Q waves associated with HOCM differs from the criteria used to analyse these waves in cases of ischemic heart disease. It has been suggested that the presence of q waves greater than 3 mm in depth or greater than 40 ms in duration should raise concerns in the young. The deepest q waves on our young mans ECG are 3 mm in depth.
C. Bifid p waves are frequently seen on normal ECGs. They represent a physiological separation of right and left atrial depolarisation and are of no significance. ‘P Mitrale’ is said to exist when the separation of the right atrial and left atrial peaks is 1mm or more (> 1 small square). P mitrale, if present, is said to be highly specific for left atrial abnormality. On this ECG the separation is less than 1 mm. This is not P mitrale.
D. T wave invesrion (TWI, circled in blue) is frequently seen in lead III in normal subjects. In this context, it is of no significance. T waves are expected to be inverted in aVR and in the young they are normally inverted in leads V1 and V2.
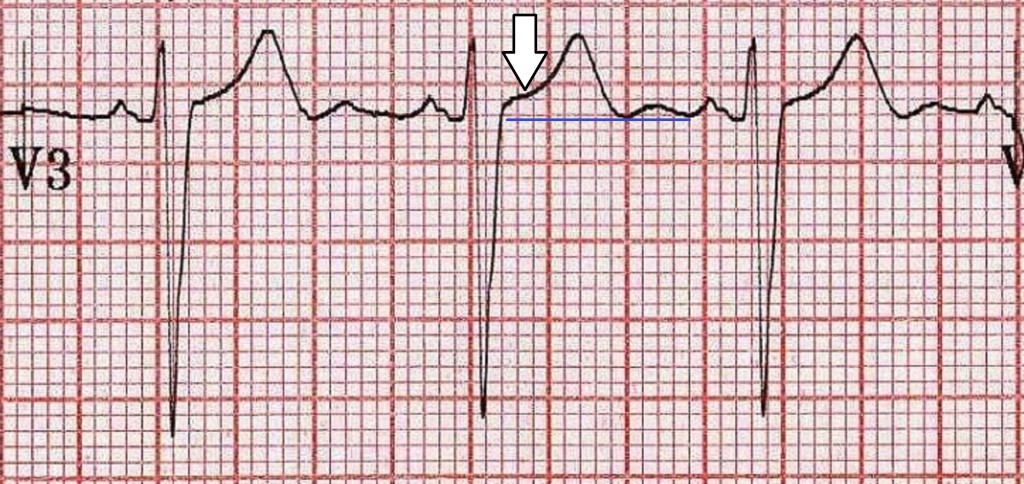
In recent years, it has been realised that ST elevation is present on the ECG of the majority of normal young men. This ‘male pattern ST elevation’ is usually observed in the right sided chest leads and is no cause for concern. The ECG under consideration is a nice example. The ST elevation (white arrow) is about 1 to 2 mm above the TP segment (blue line) and has a characteristic morphology (‘concave upwards’ shape). ST elevation in this scenario follows a deep S wave and in turn is followed by tall upright T waves. Inverted T waves in this situation might be a cause for concern but it is worth remembering that ST elevation in the chest leads in conjunction with T wave inversion may be a normal variant in young men of sub-Saharan African origin.
We said ‘5 tips’ but we should probably factor in one more

Our profession is ruled by risk aversion. As the tyranny of preventative medicine creeps into sport, a few words of wisdom seem appropriate. Some years ago my wife and I were house-hunting in the area around Perpignan. Our driver was an elderly french gentleman, small in stature but memorably charismatic. A former paratrooper in the Free French Forces, he had fought behind German lines during the battle to liberate occupied France and had the serenity and charm of a man who had ‘seen it all’. Sitting beside a swimming pool in the small village of Fitou, at a moment of doubt, he turned to us and said, ‘don’t let fear stop you from doing anything in life, a life worth living always carries risks’. Sound advice.
DisclaimerPrivacy PolicyTerms of UseData Deletion© Acadoodle 2025