Understanding the mechanism generating tachycardia in atrial flutter and a knowledge of a few 'tricks of the trade' can help increase our chances of making the diagnosis of this arrhythmia.
Some of the terms in this article: ss: small squares, bpm: beats per minute, HR: heart rate, index ECG: the ECG featured in the case 'a challenging ECG diagnosis'.
Disclaimer: this article is an opinion piece. The views expressed are not endorsed by any clinical body.
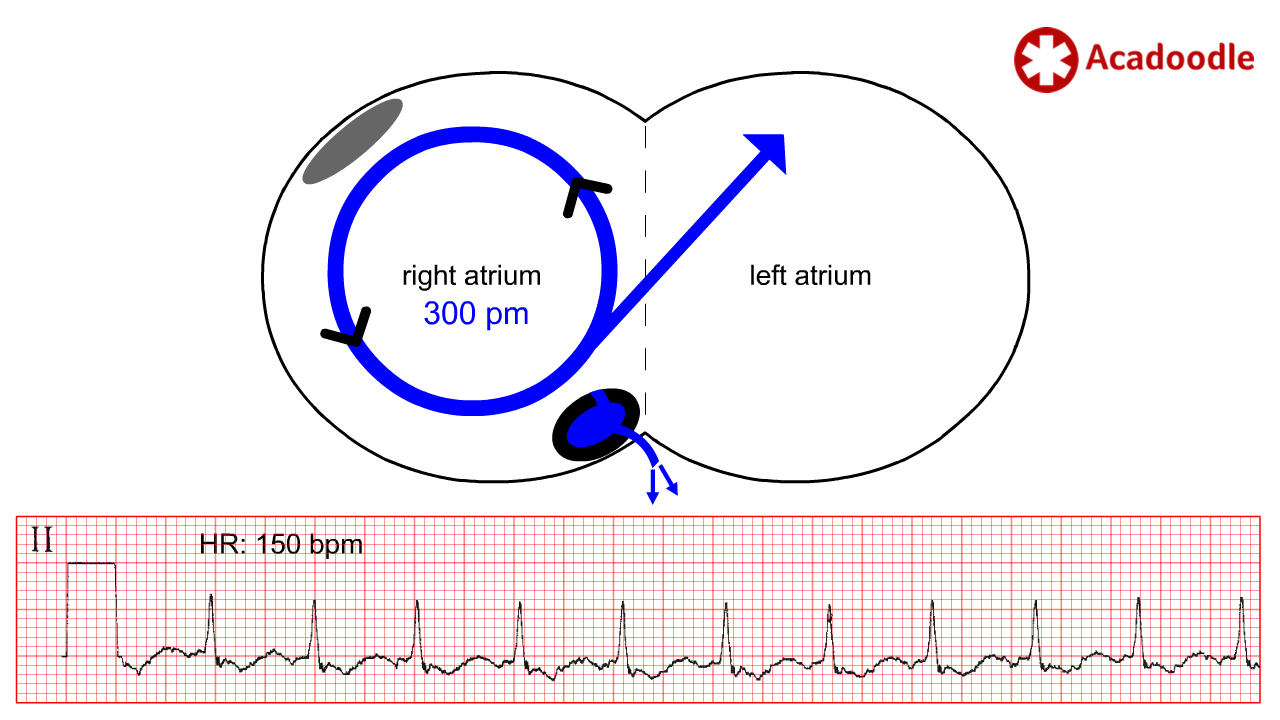
In atrial flutter, a re-entrant loop of depolarization (blue circle) circulates (black arrows) in the wall of the right atrium. Each cycle discharges a depolarization wave superiorly into the left atrium depolarizing the atria (blue arrow). The rate of atrial depolarization mediated by the re-entrant loop in this condition varies between cases from about 200 to 400 discharges per minute. In the majority of cases, the rate of atrial depolarization is in the region of 300 discharges per minute. To make the diagnosis of atrial flutter we need to identify evidence on the ECG of atrial depolarization occurring at or near this rate (while remembering that there is a range of possible rates).
The diagnosis of atrial flutter is confirmed by identification of atrial depolarization occurring at a rate between 200 and 400 times per minute. Usually in the region of 300 times per minute.
If 300 atrial depolarization events per minute were conducted to the ventricles, the resulting heart rate would result in failure of the ventricles to fill with blood between beats with a potentially lethal fall in cardiac output. However, the AV node is uniquely capable of mediating ‘decremental conduction’. In situations of very rapid atrial depolarization, the node will only conduct some fraction of the atrial depolarization events to the ventricles. This is a life-preserving phenomenon limiting the rate of ventricular contraction to a fraction of the rate of atrial depolarization.
Decrement origin: early 17th century (as a noun): from Latin decrementum ‘diminution’, from the stem of decrescere ‘to decrease’. Meaning: Cause a discrete reduction in
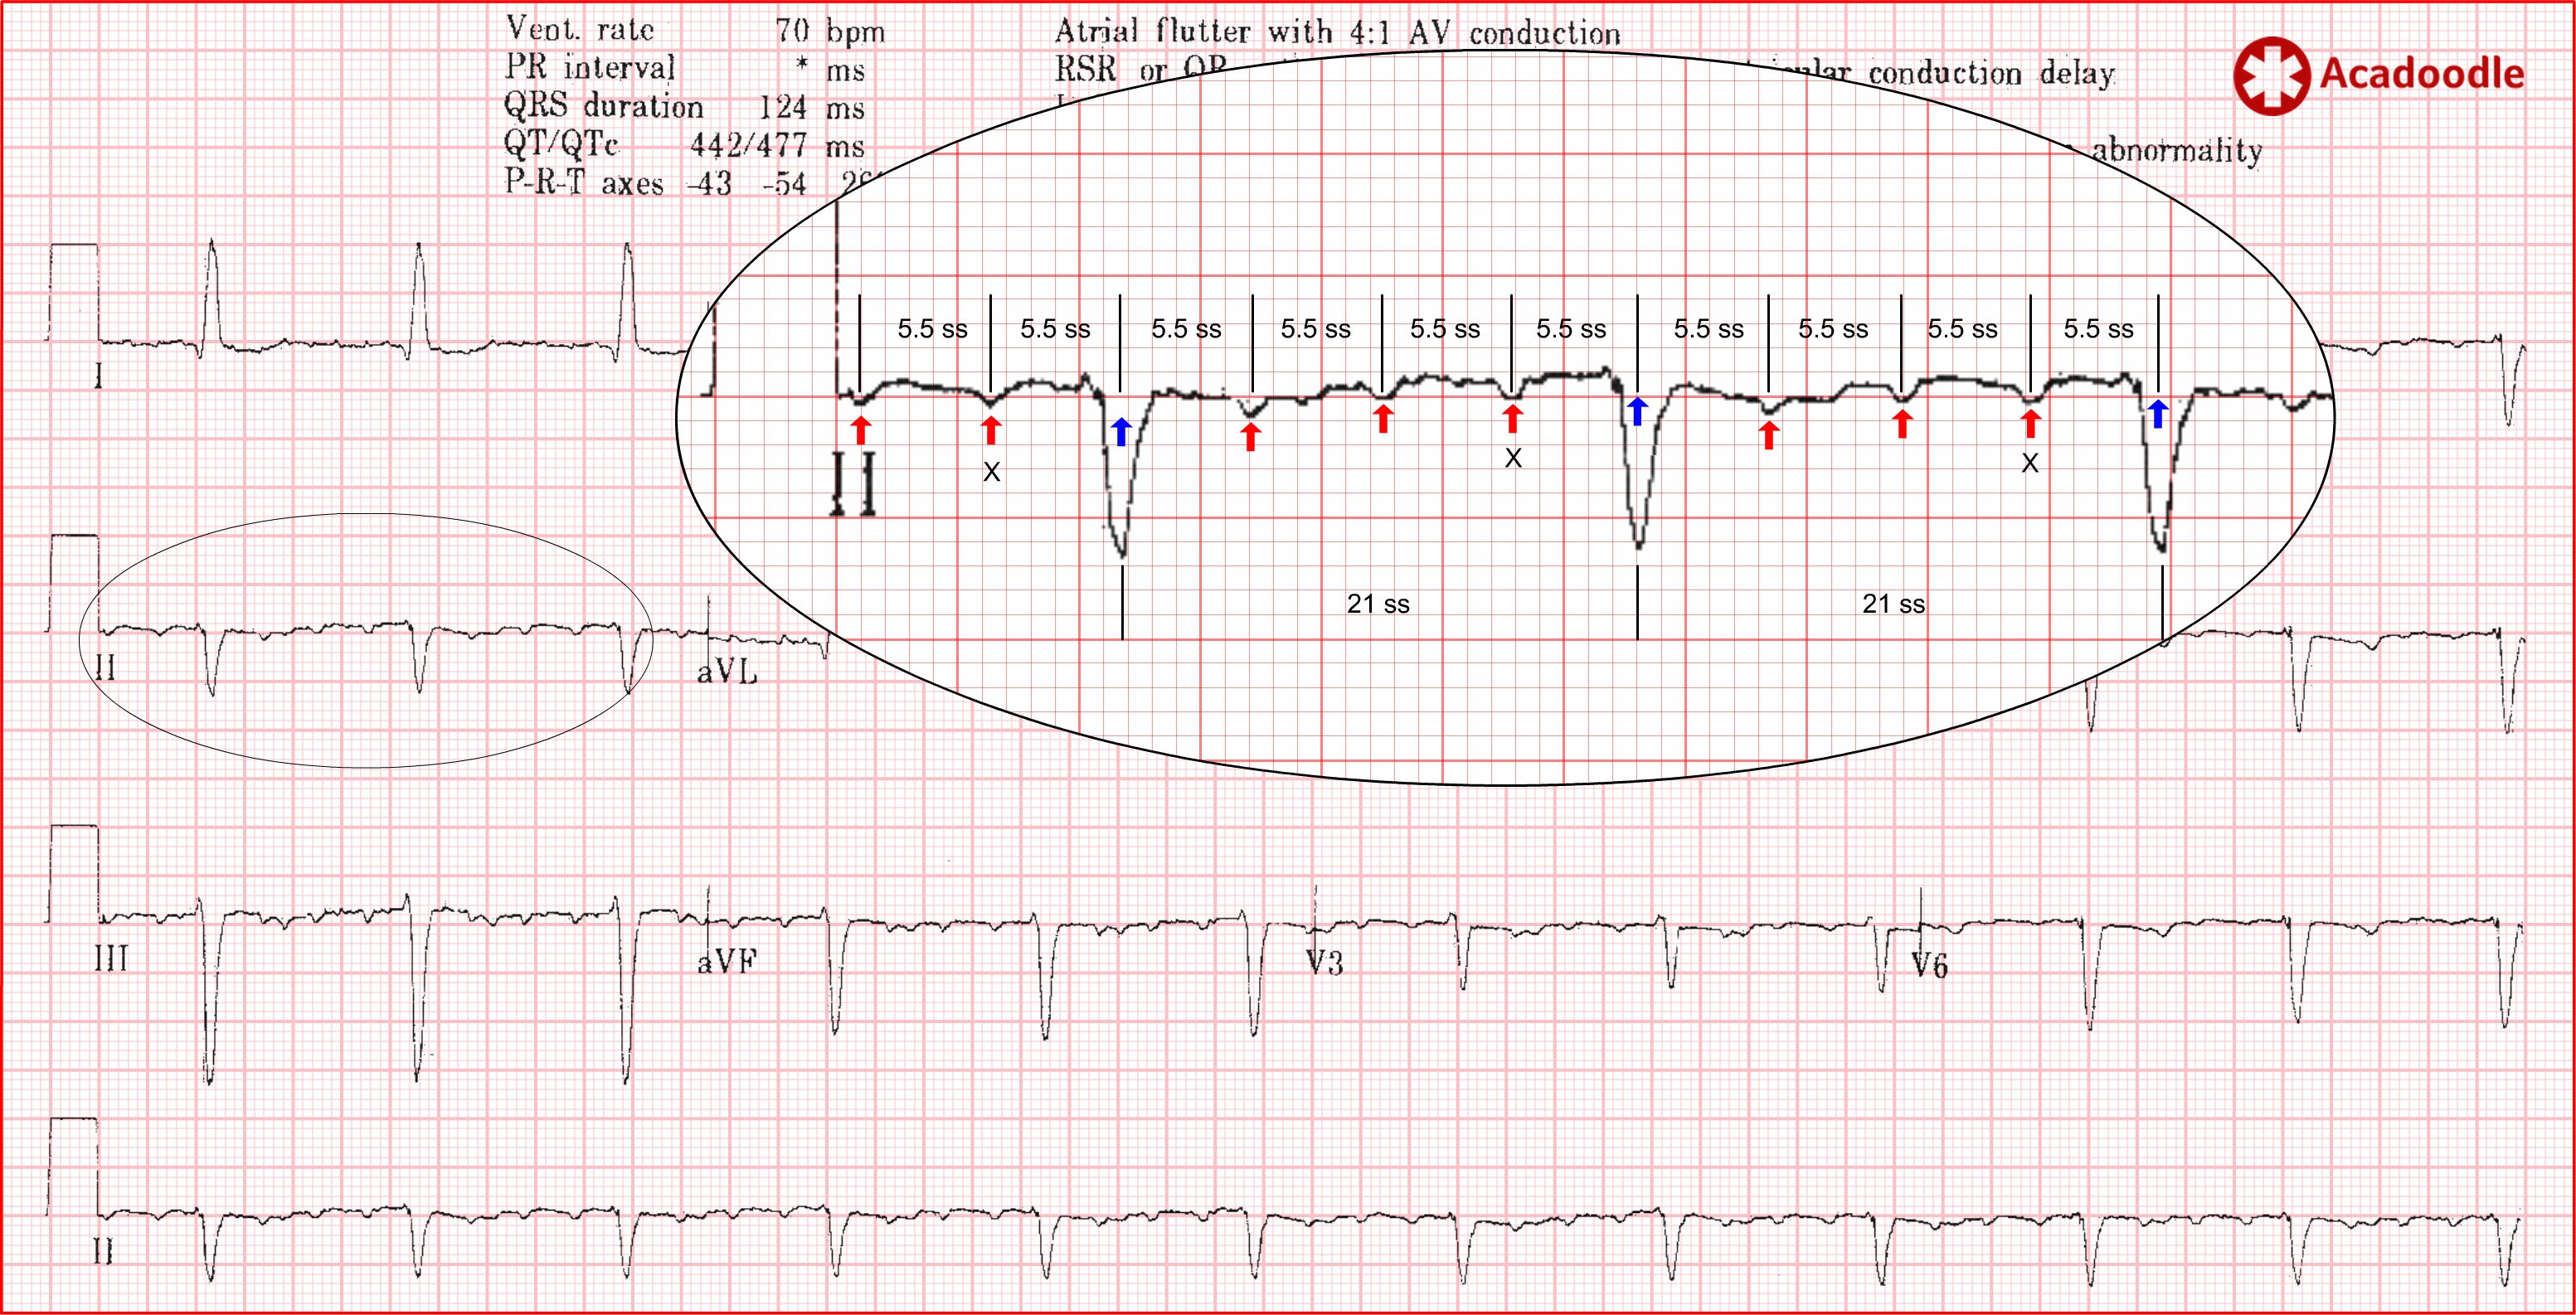
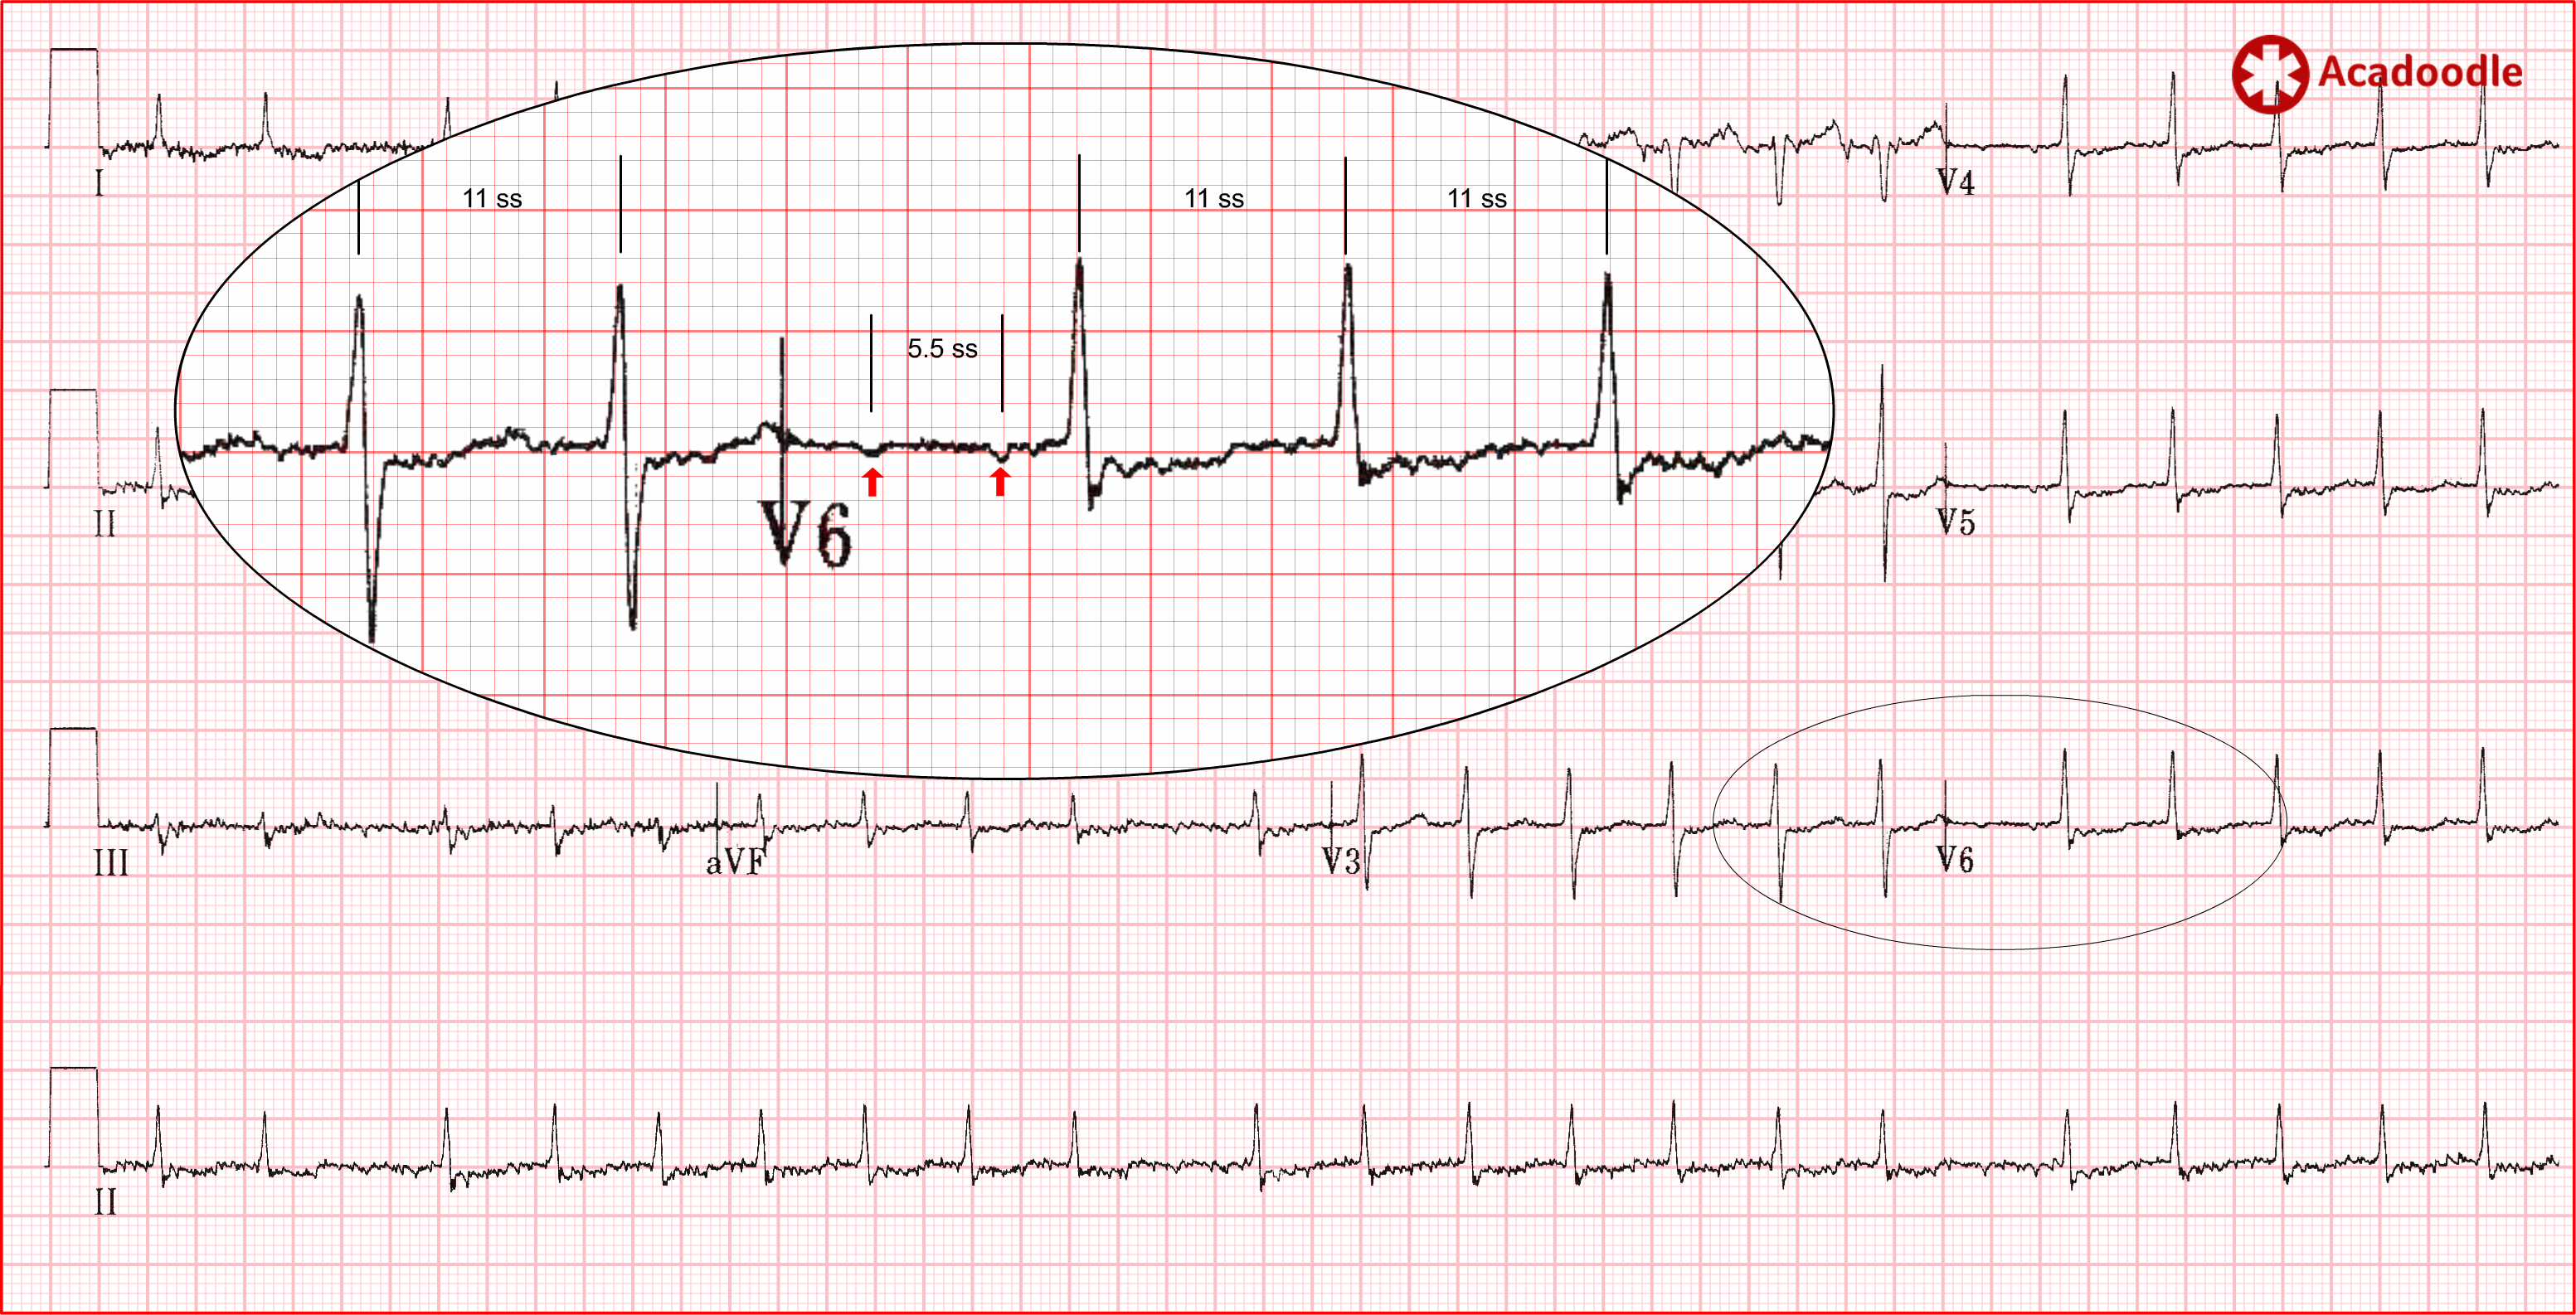
The ECG above shows atrial flutter with 4 to 1 conduction. Note that, at this conduction ratio, we can easily make out 'flutter waves' (red arrows) occurring approximately once every large square. They are negative in the inferior leads (II, III and aVF consistent with a superiorly directed axis). There are, in fact, 5.5 small squares (ss) between flutter waves. The atria are depolarizing 272 times per minute (1500/5.5). Conducted flutter waves are marked with an X. With 1 in every 4 flutter waves conducted through the AV node, the ventricular rate is approximately 70 bpm. The blue arrows indicate the position of flutter waves obscured by the qrs complexes.
As illustrated by our index case, diagnostic problems arise when atrial flutter occurs with a conduction ratio of 2 to 1. In this situation, evidence of rapid atrial depolarization may be obscured. If we take the 'close up' of lead II from the ECG above and use computer graphics to adjust the conduction ratio of 2 to 1, you will appreciate the problem. Half of the flutter waves have fused with the qrs complexes and are indiscernible (blue arrows in image below indicate 'hidden' flutter wave locations).
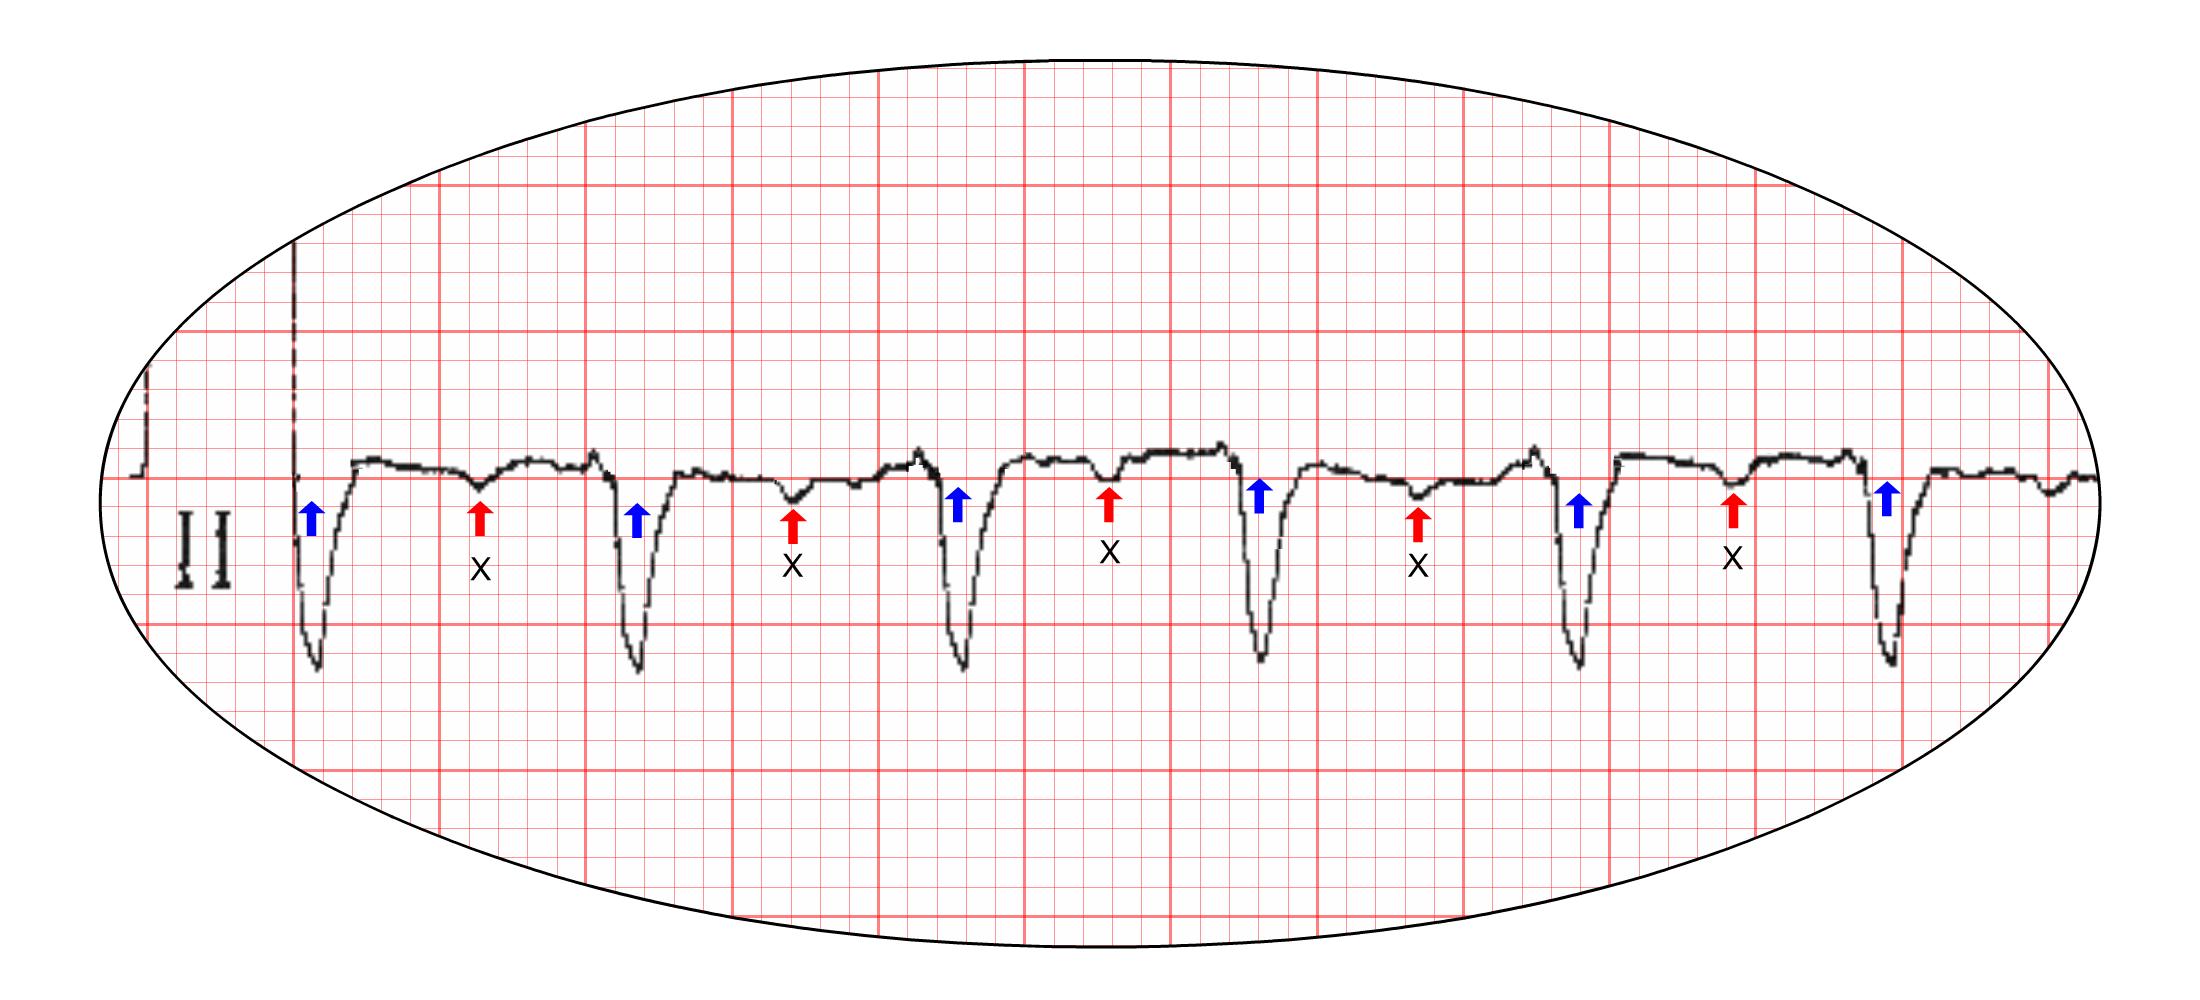
Furthermore, note that the T waves are of low amplitude in the frontal leads on this particular ECG. More usually, prominent T waves in the inferior leads will fuse with and obscure the conducted flutter waves (marked above by an X). In cases of flutter with 2 to 1 conduction, all direct evidence of atrial depolarization may be obscured in the frontal leads necessitating inference of the rate of atrial depolarization from other features on the ECG.
We can maximise our chances of picking up the diagnosis of atrial flutter with 1 in 2 conduction by following a few simple rules.
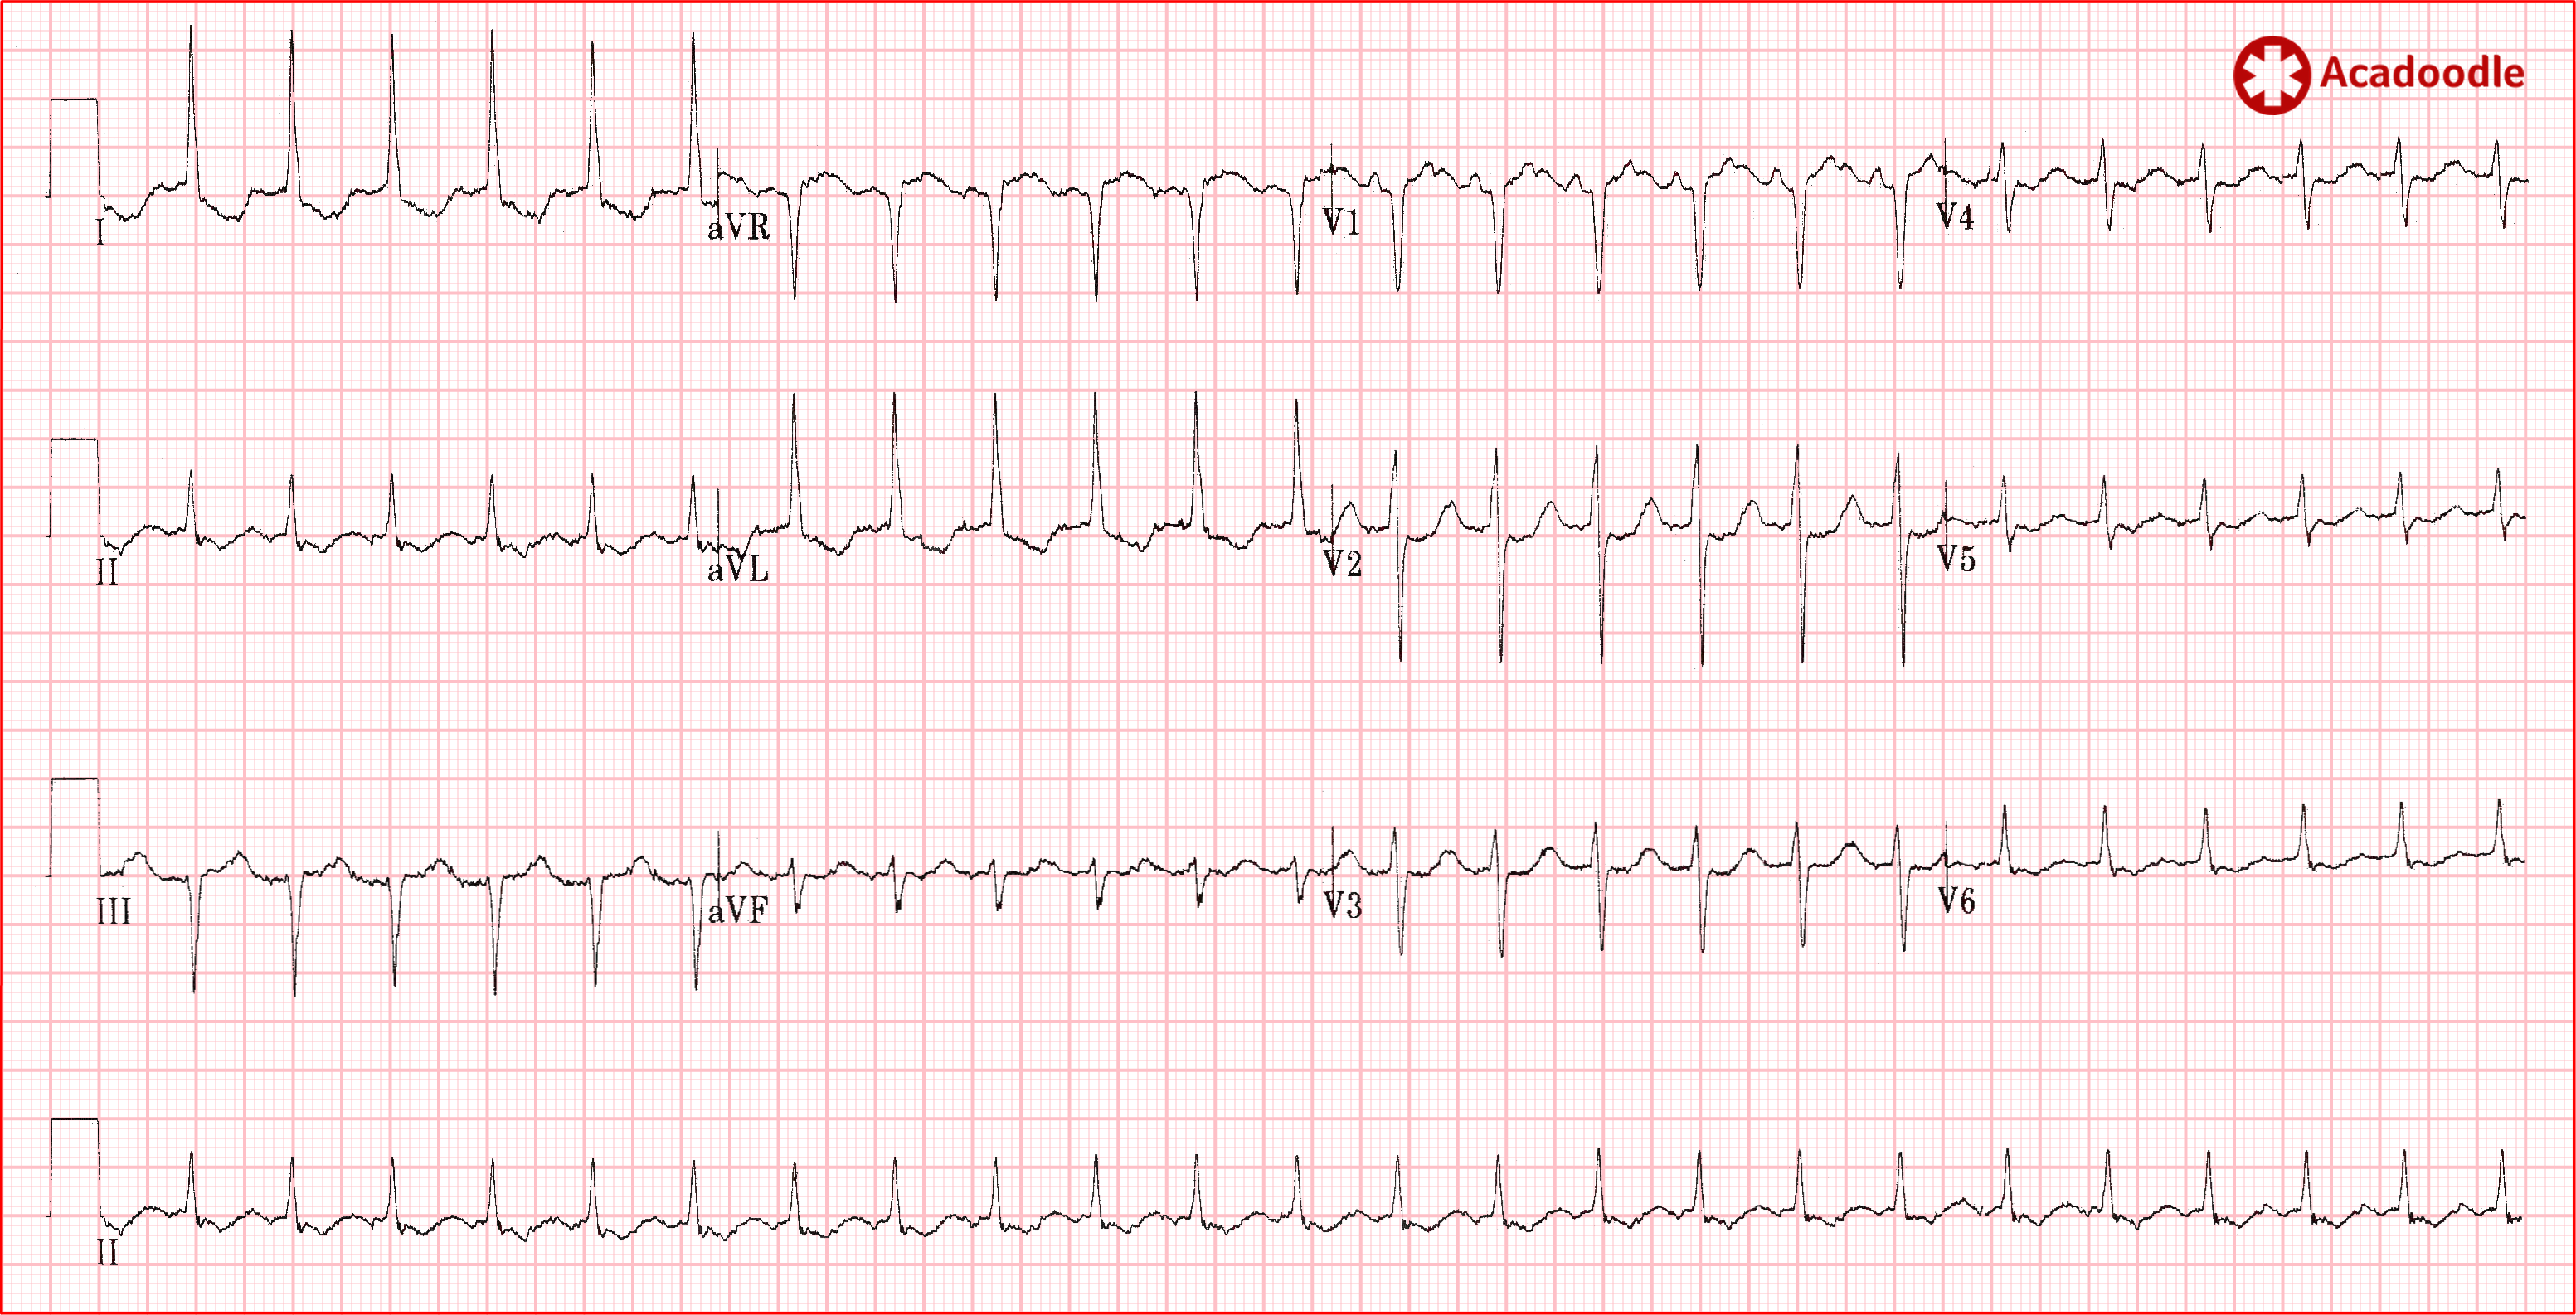
Whenever we see a tachycardia with a heart rate in the region of 150 beats per minute, we must consider the possibility of atrial flutter with 2 to 1 conduction. I would take this further and say, in the presence of tachycardia, if you see two large squares between consecutive qrs complexes anywhere on the ECG, consider flutter! Two large squares between qrs complexes equates to a rate of 150 bpm. On first glance, I thought that the ECG below was a case of rapid atrial fibrillation.
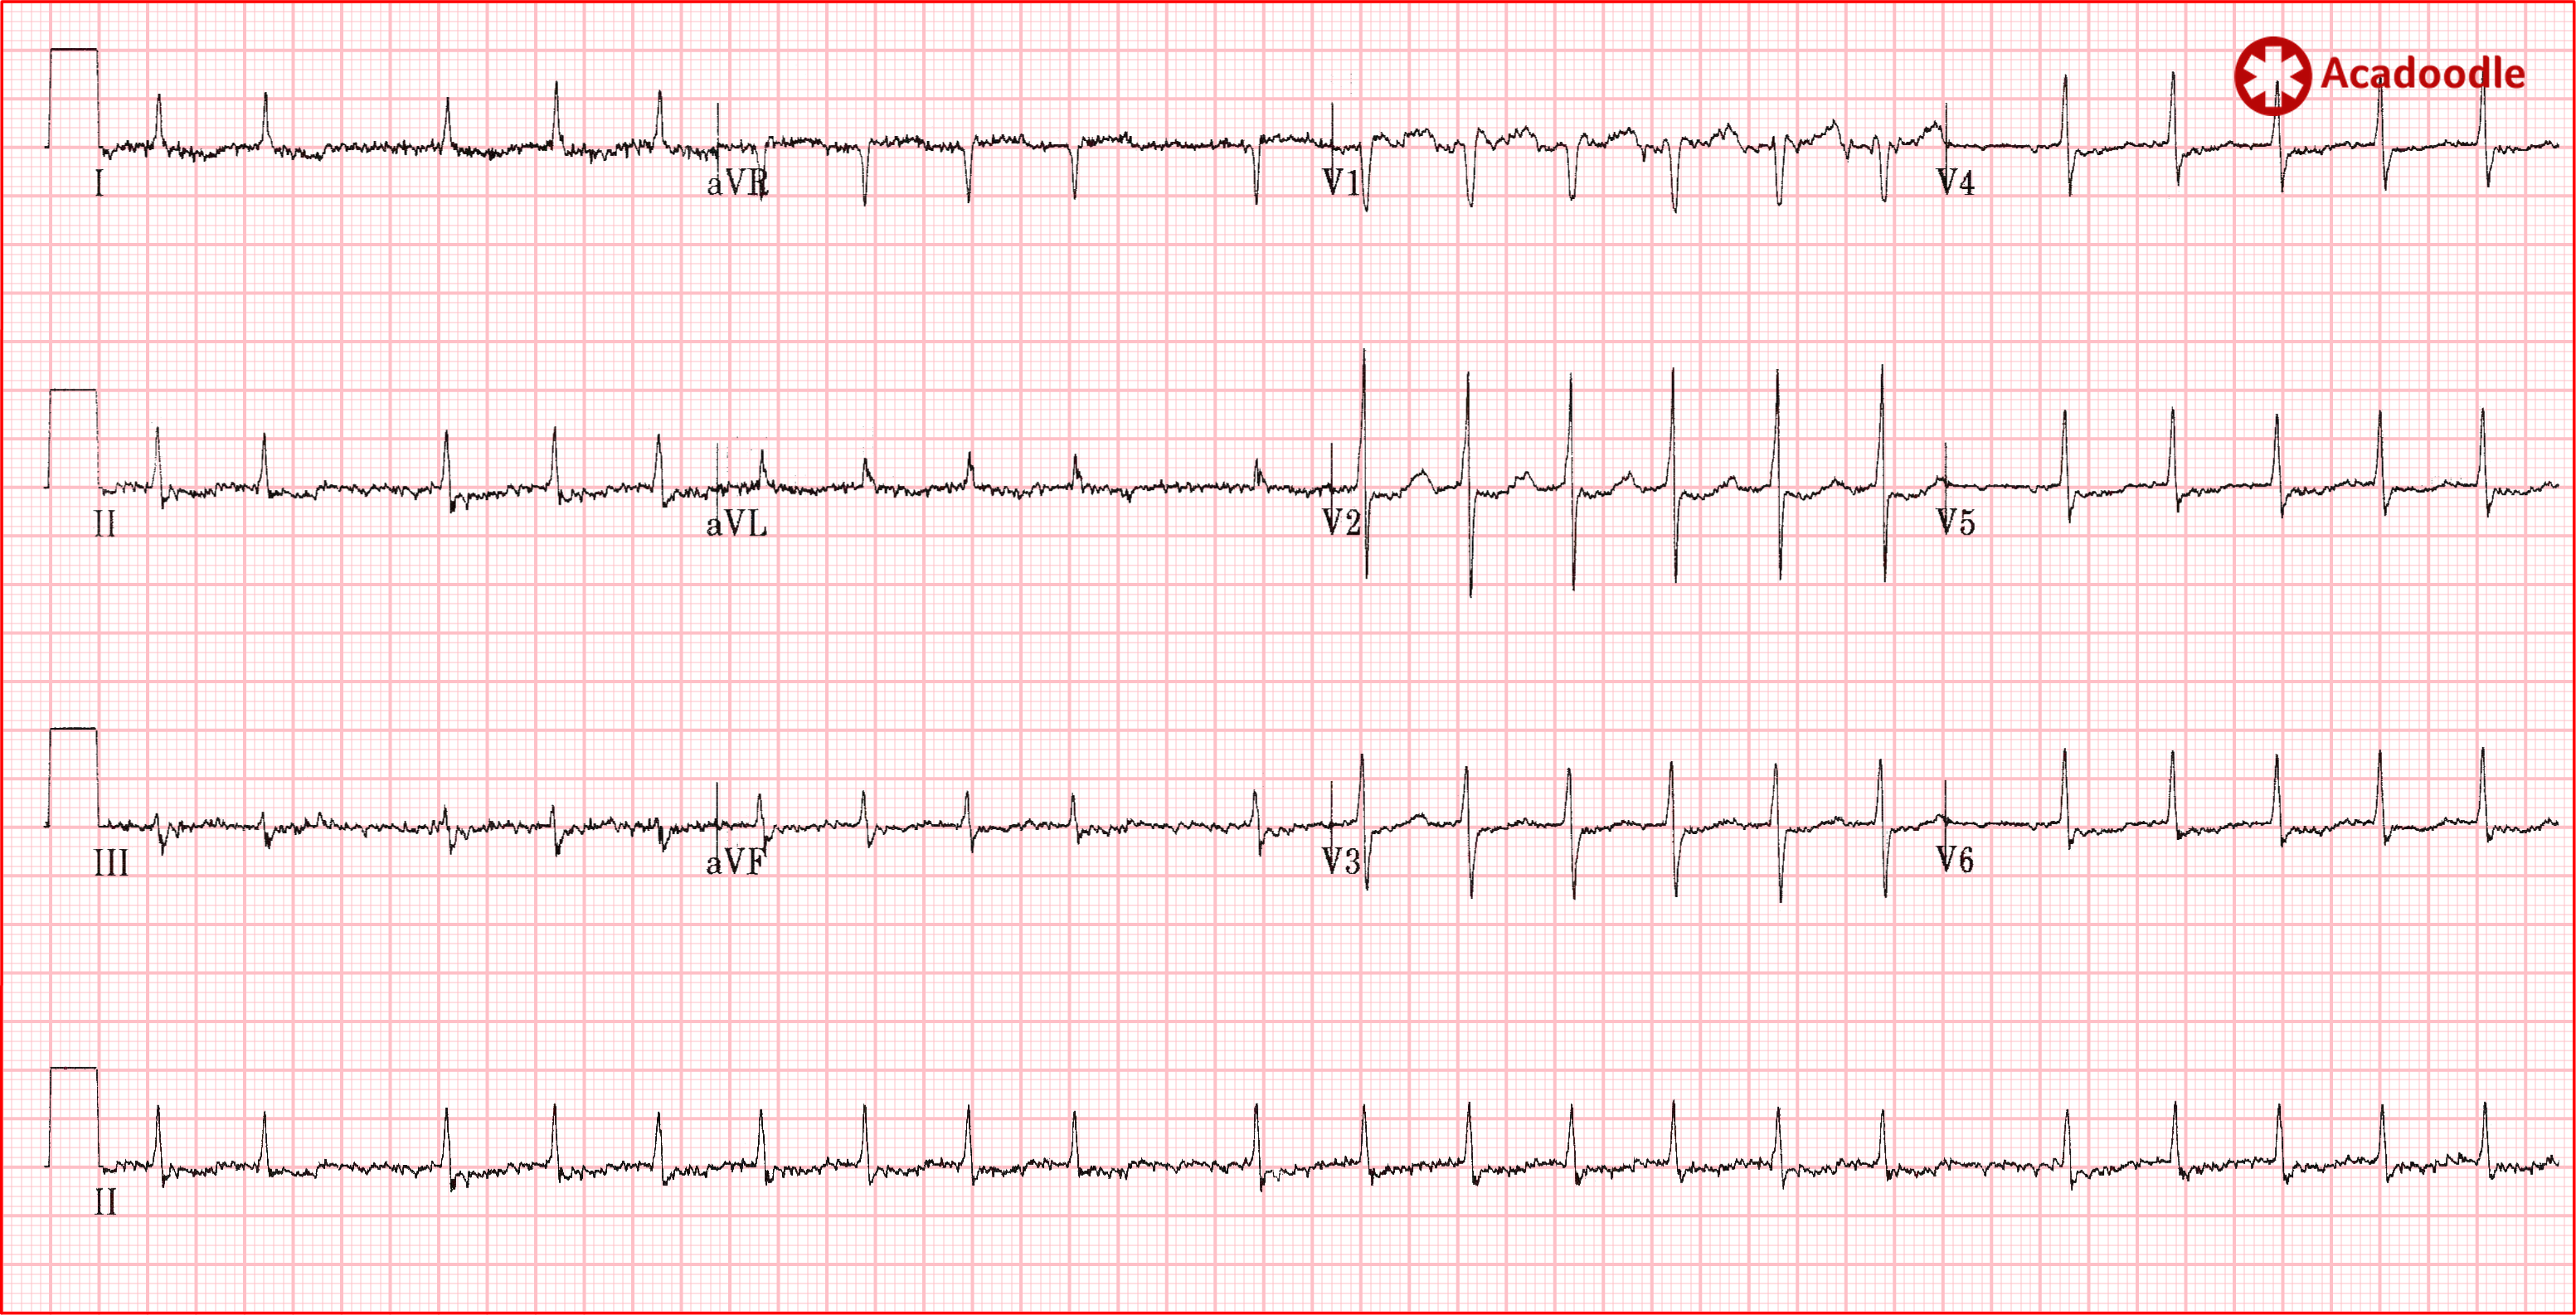
Note, however, that the distance between consecutive R waves is close to two large squares in areas on this ECG.
As shown in the magnified region (image below), on closer examination, when we examine areas of the readout associated with a slower heart rate we can clearly identify flutter waves occurring at a rate of 272 (1500/5.5) times per minute. This most obvious in the chest leads ('always do a 12 lead'). This is atrial flutter with variable conduction.
Flutter waves conducted into an intact ventricular conducting system result in the classical monotonously regular narrow complex tachycardia as seen in our index case ECG. However, many patients presenting with new onset atrial flutter will have co-existent damage to the ventricular conducting system as both conditions are associated with underlying ischemic heart disease.
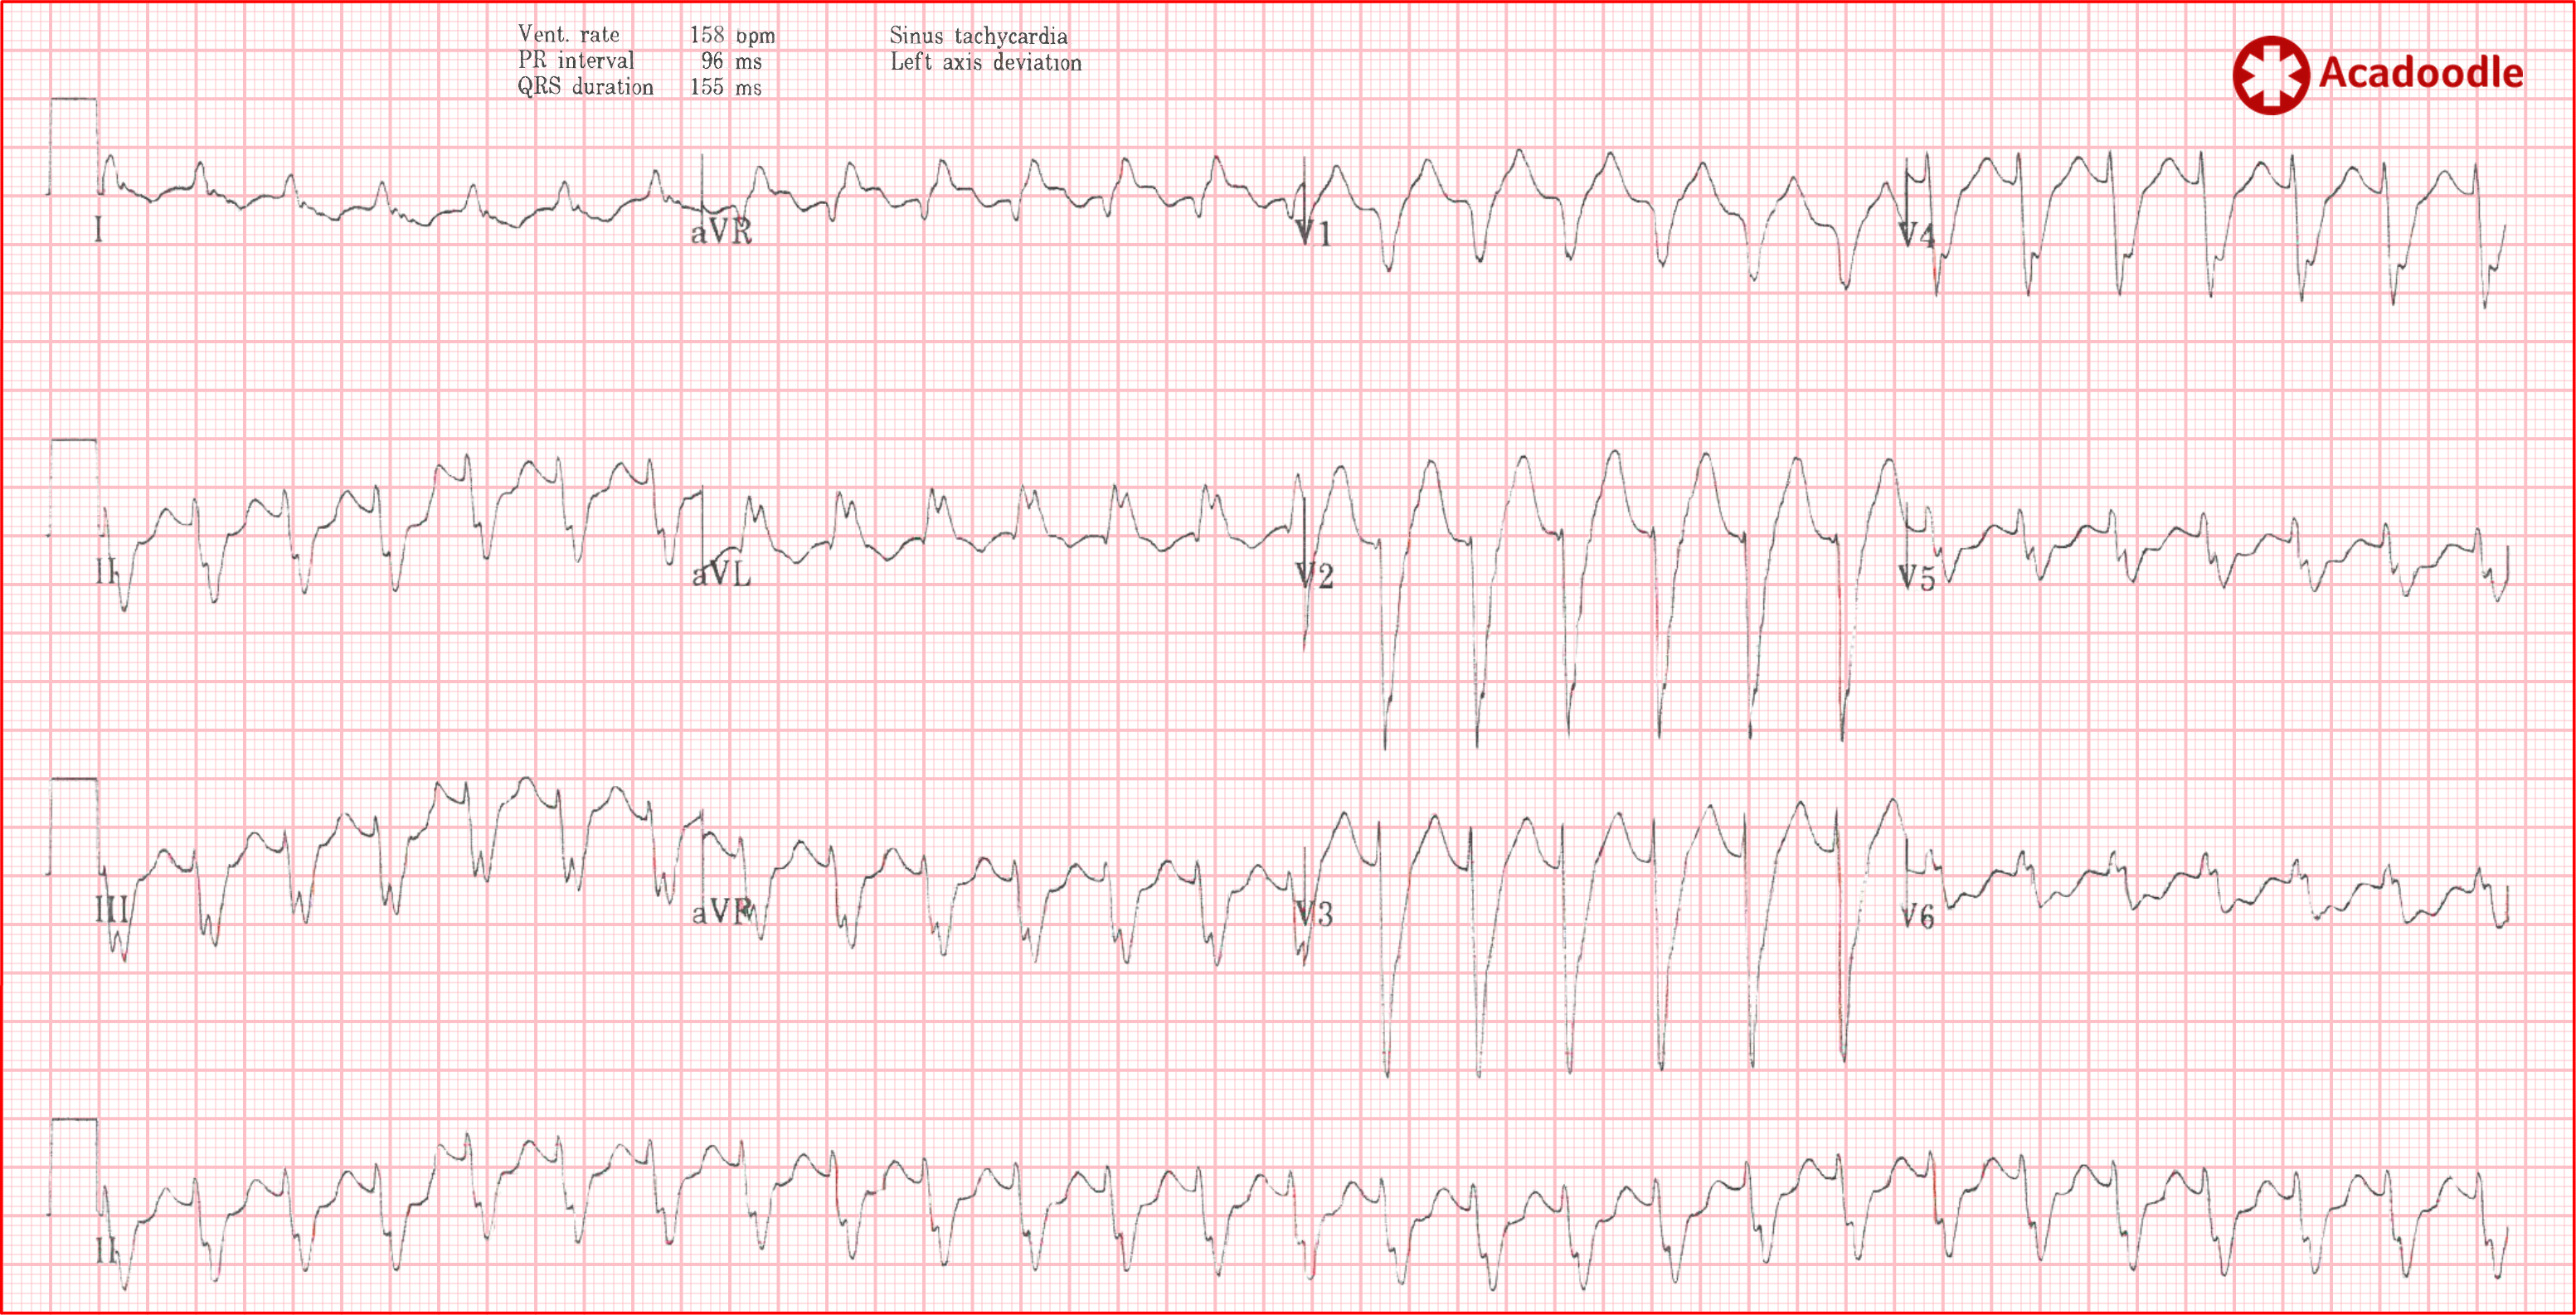
This ECG shows a regular broad complex tachycardia with a heart rate close to 150 beats per minute. The patient is hemodynamically stable. This is atrial flutter with 2 to 1 conduction. Aberrancy due co-existent left bundle branch block accounts for the broad qrs complexes. 1) How do we know this for certain? and 2) what is the definitive evidence for atrial flutter on this ECG (as opposed to VT for example)? 1) We don't and 2) there is none. The rate is close to 150 beats per minute and there is an impression of a continuous background undulation of the isoelectric line. Under monitored conditions, administration of intravenous adenosine confirmed the presence of flutter waves, making the diagnosis of atrial flutter. This brings us on to our next point.
As atrial flutter is an AV node independent tachycardia (see our article on this topic) administration of intravenous adenosine is not indicated. However, it is sometimes given under controlled conditions to distinguish between SVT with aberrancy and VT as a cause of broad complex tachycardia. It may also be given inadvertently to cases of atrial flutter mistaken for an AV node dependent SVT.
During complete transient block of conduction through the AV node induced by intravenous adenosine, flutter waves may become obvious clinching a diagnosis of atrial flutter.
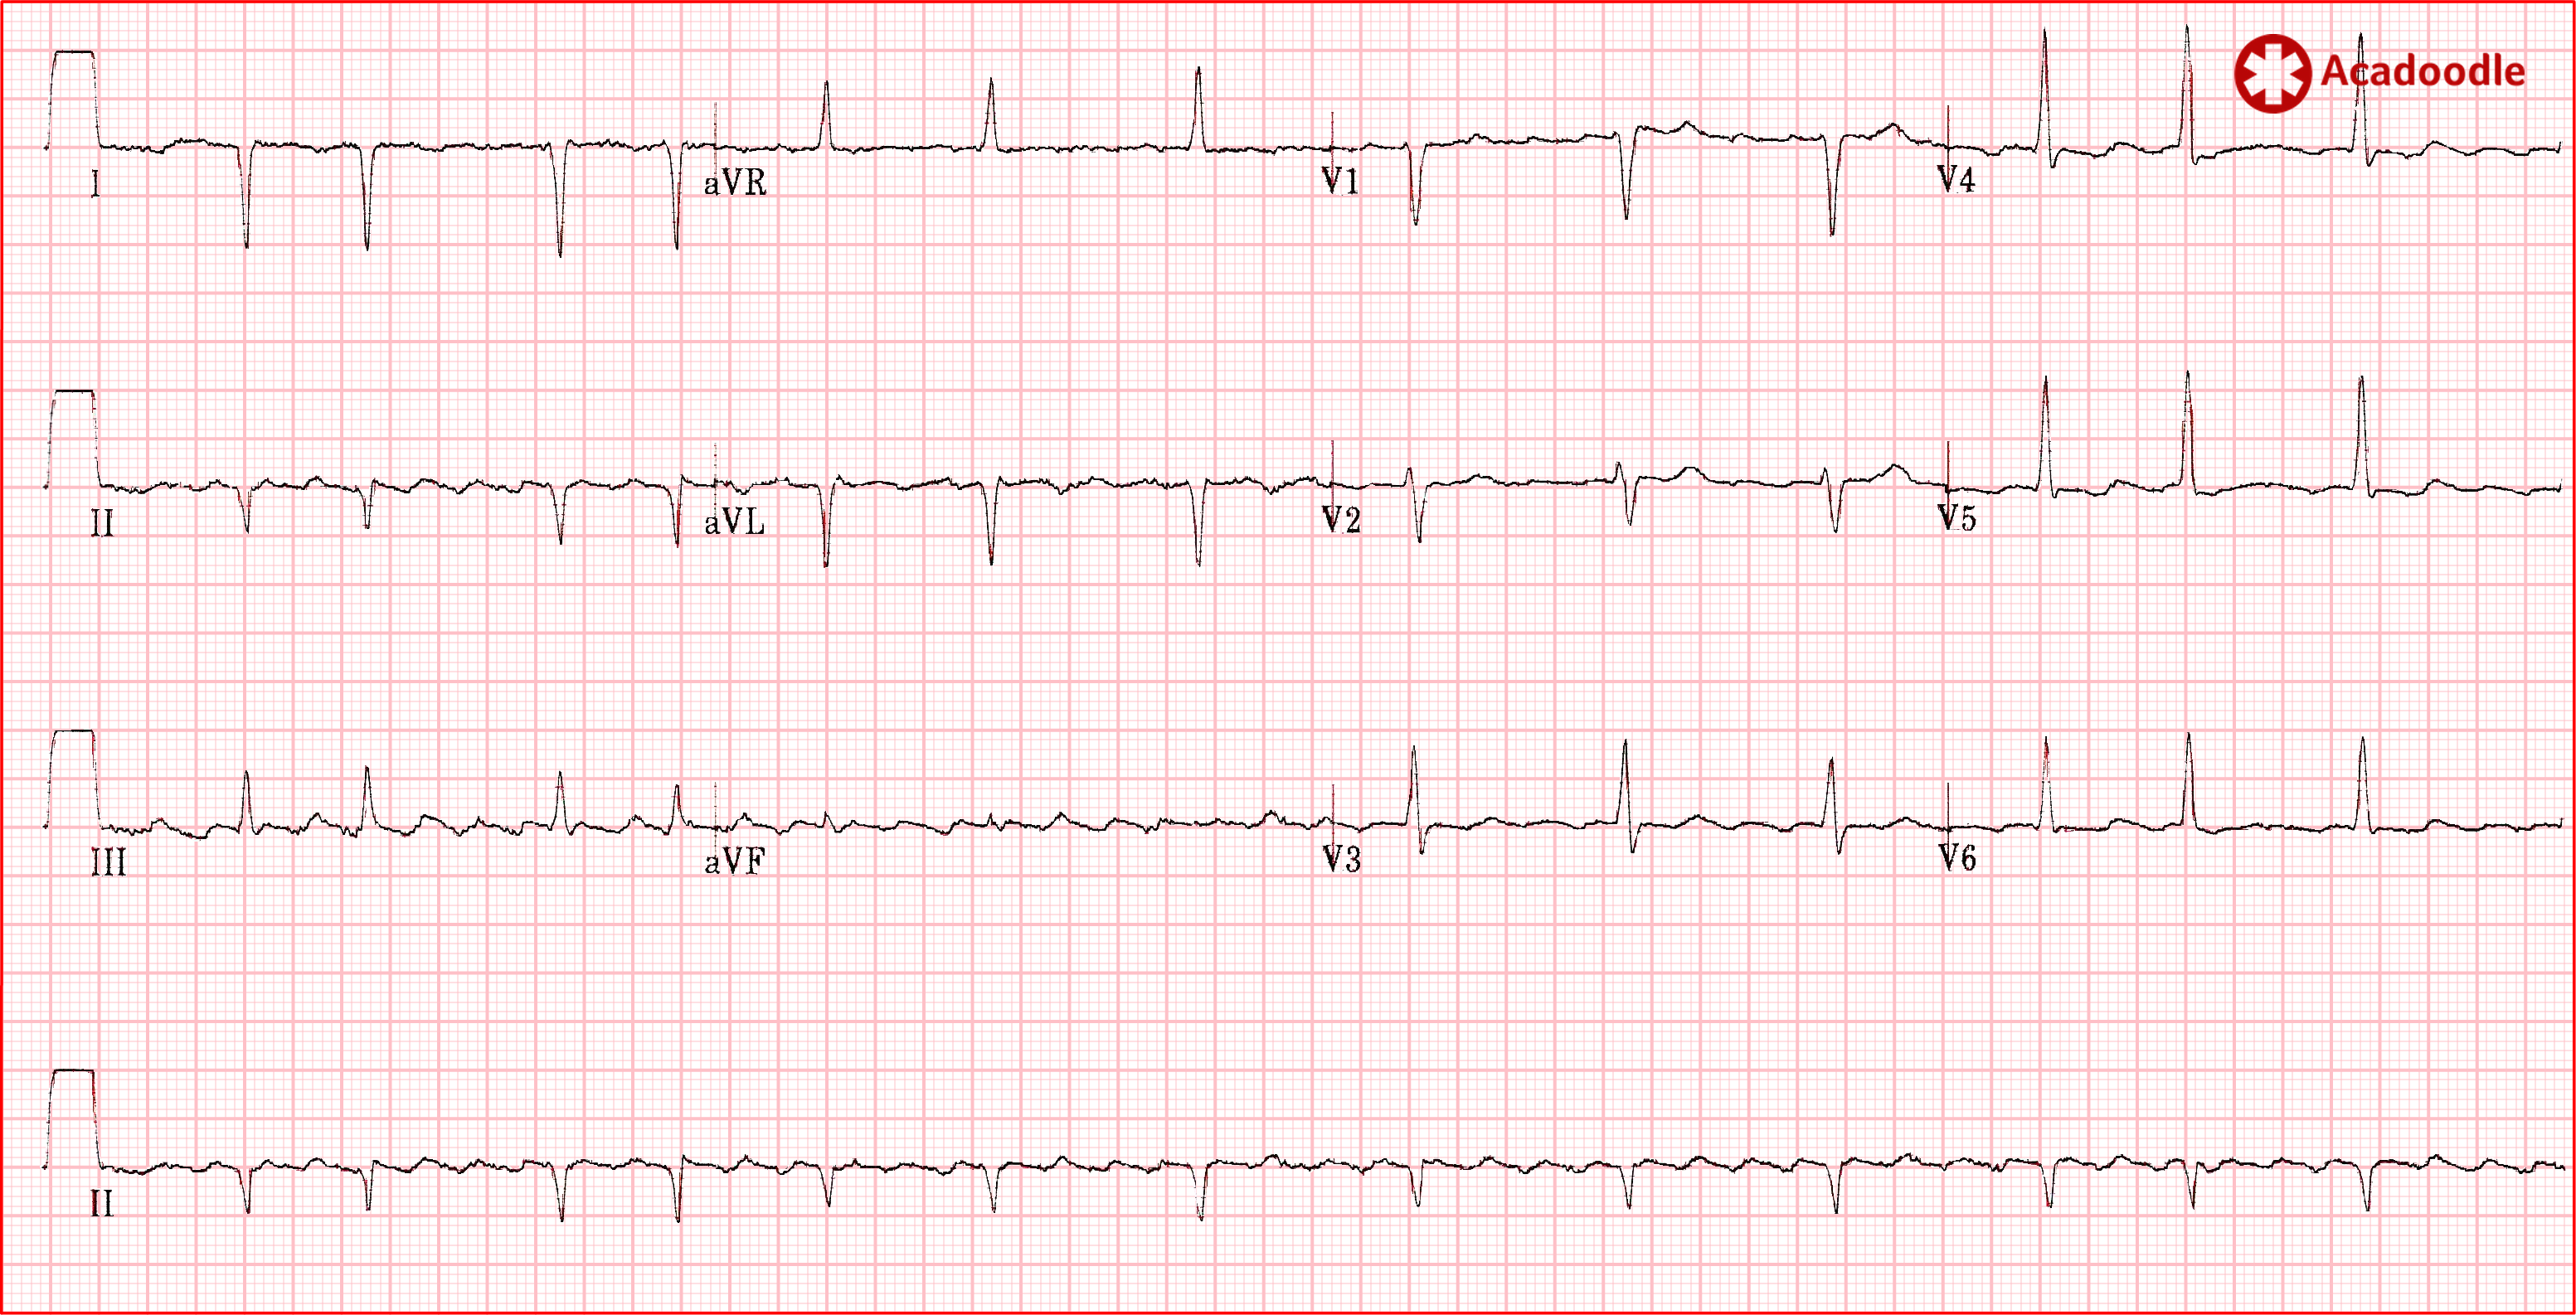
The doctor reviewing the index ECG has mistaken the rhythm for probable sinus tachycardia due the presence of 'P waves' in lead V1. On occasion, flutter waves in lead V1 resemble upright discreet P waves. In such circumstances we should look for an indicator of the presence of very rapid depolarization atrial depolarization, beautifully illustrated on the index ECG under discussion.
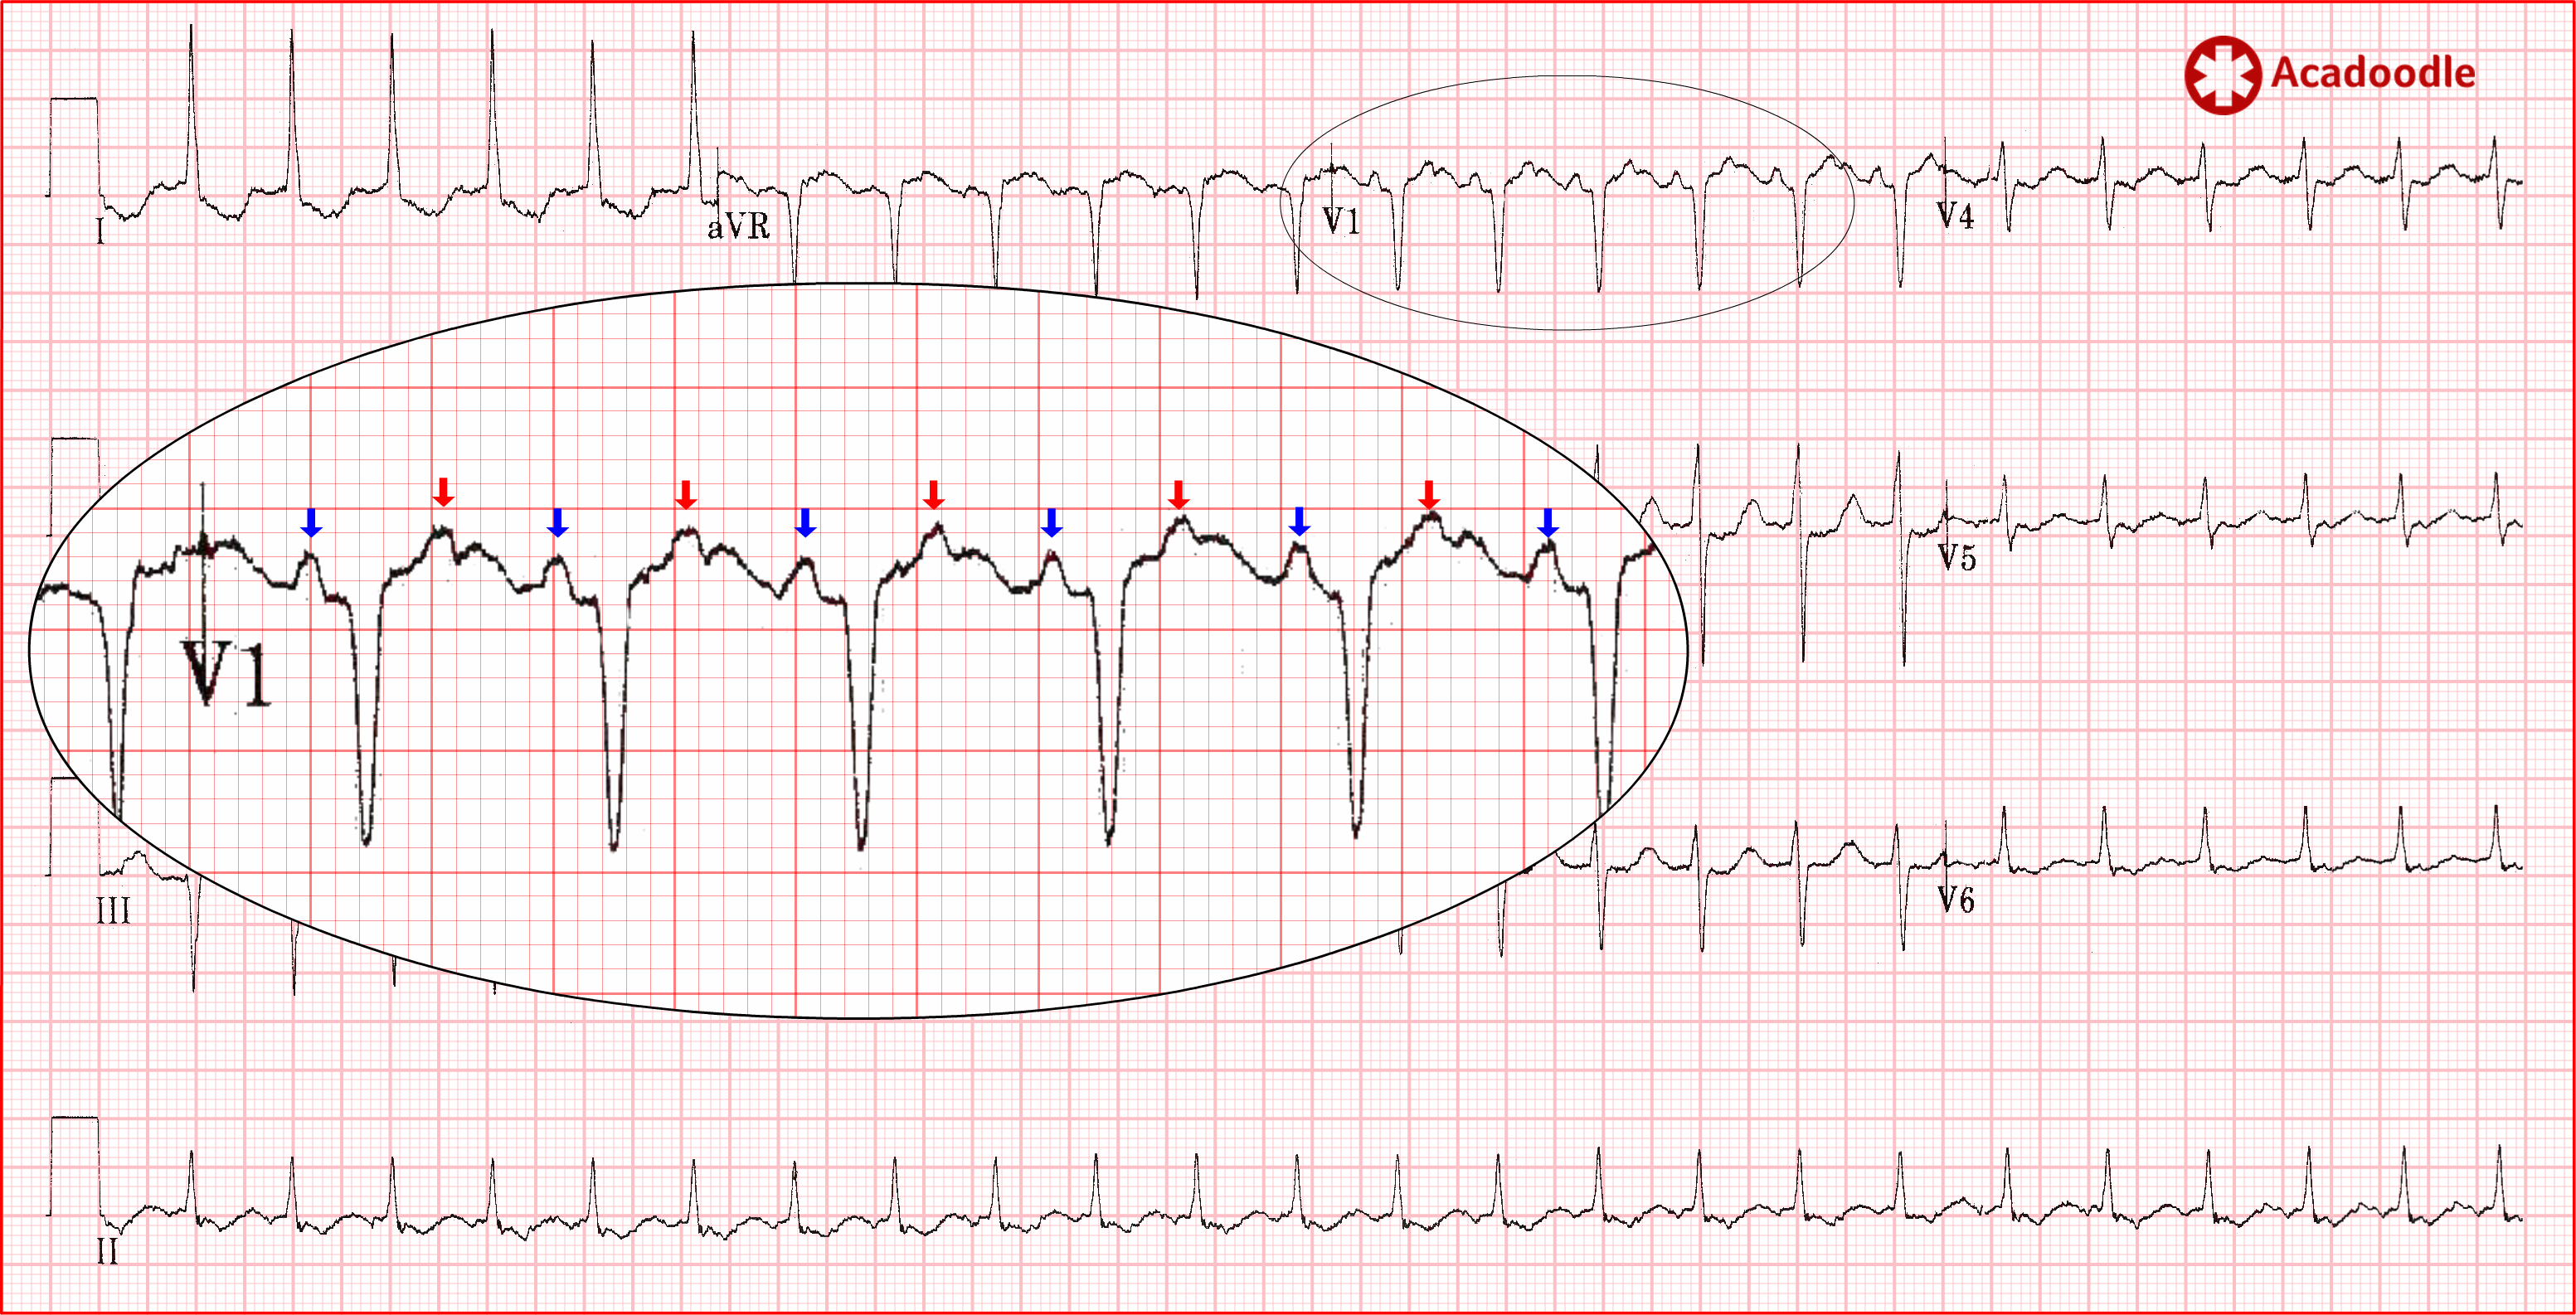
In the magnified region (lead V1), the 'P waves' are indicated by the blue arrows. Note that they occur just over once every 10 small squares (1500/10: 150 times per minute). However, if we look at the half way point between these deflections, we can identify a consistent distortion of the T wave with the same morphology and axis as the putative 'P waves' (red arrows). These are fusion complexes between atrial depolarisation events and T waves. Atrial depolarisation is occurring at a rate of 300 times per minute on this ECG. This is atrial flutter with 2 to 1 conduction.
Note also that the reviewing doctor has probably mistaken the flutter-related undulation of the isoelectric line in the anterior leads as ischemia related ST segment depression and T wave inversion. In fact, I think the T waves are probably upright in the anterior leads. They appear biphasic because of fusion of their initial portion with flutter waves.

Note that, in the case of broad complex tachycardia above, the computer interpretation (CI) has given us an incorrect diagnosis. This is common and can be very misleading for the inexperienced. There is no substitute for your own careful analysis of the ECG and your 'feel' for the overall clinical context.
Having said that, I have seen the computer interpretation prompt appropriate changes in ECG interpretation on a number of occasions. In the example below, a senior doctor is trying to impress the medical students and Junior doctors on a Monday morning ward round with his knowledge of ECGs.
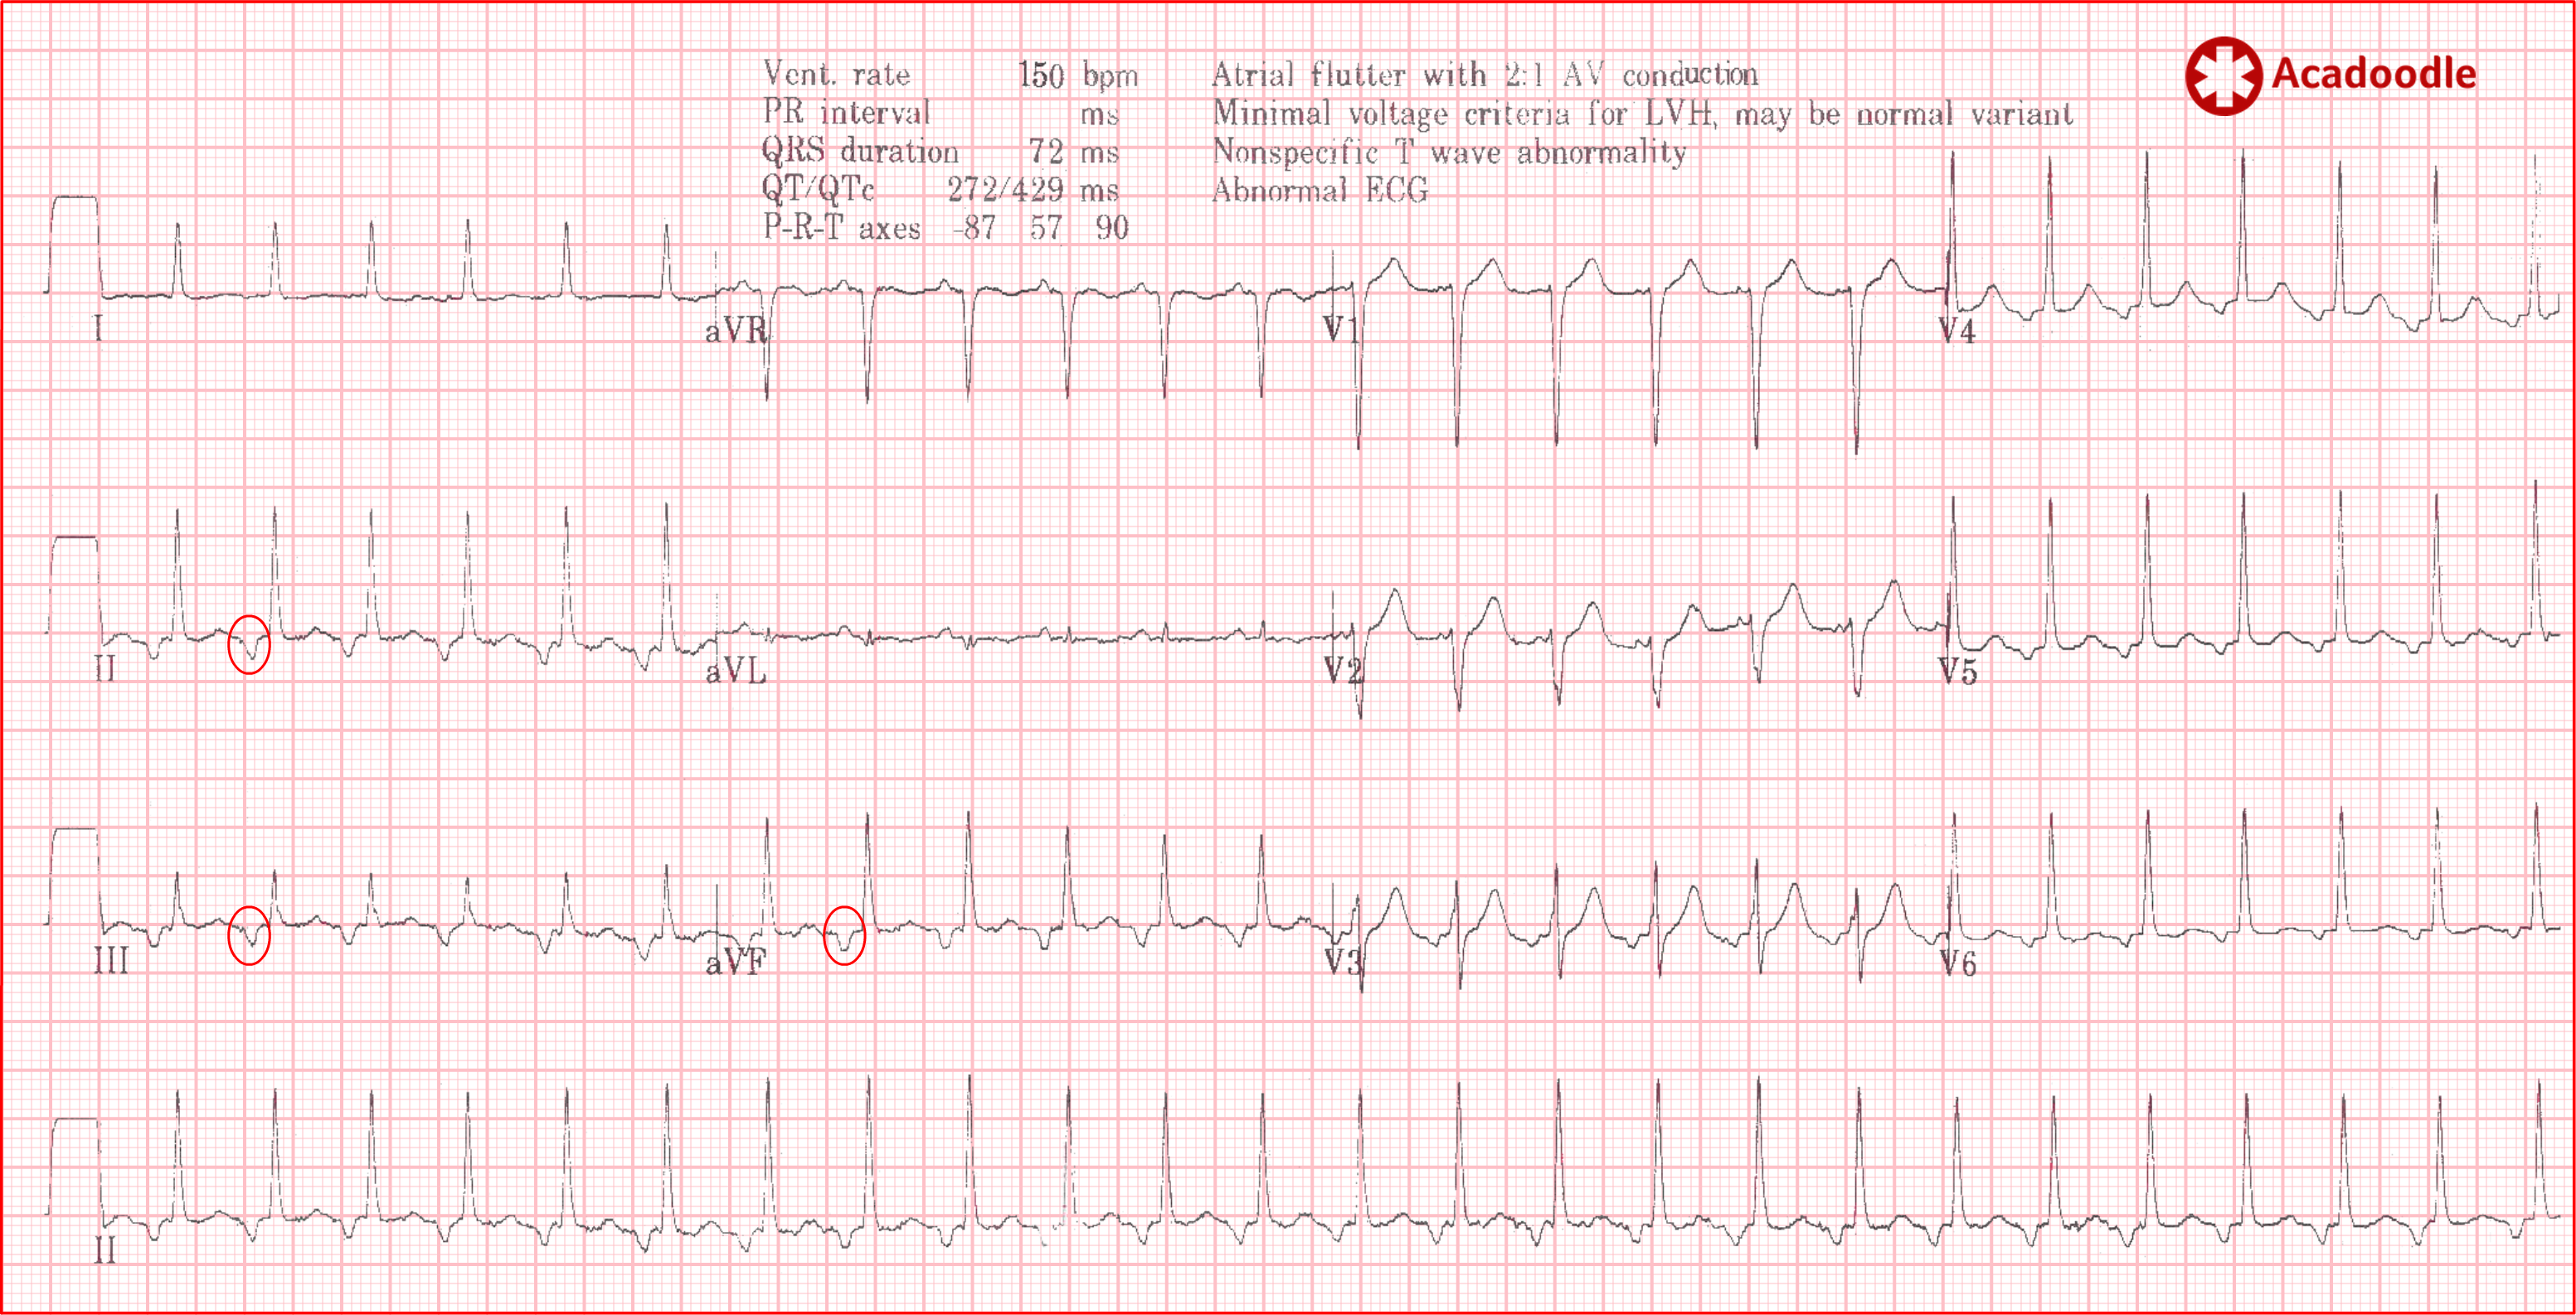
The consultant is explaining that the 'P wave' axis ('P waves' circled red) is abnormal on this ECG consistent with an ectopic atrial tachycardia, well into the long-winded dissertation he spots the computer interpretation (CI) and thinks. 'Oh hang on, of course, I haven't seen flutter waves look like those before but the deflections do have an axis directed superiorly and it's a bit fast for ectopic atrial, perfect for flutter. The CI is right, this is atrial flutter. How can I change tact now without complete loss of face with the Juniors?'
The ECG shown here screams 'flutter'. Even though the rhythm is irregular we note the well known 'sawtooth' pattern in the inferior leads (most marked in lead III) produced by fusion of flutter waves with deflections associated with ventricular depolarization and repolarization. This is atrial flutter with variable conduction ratio. Note that the flutter waves are positive in lead V1, a frequent finding. The sawtooth pattern should be sought in all leads, in some instances the sawtooth pattern is more obvious in the chest or anterior leads.
Re-entrant mechanisms generate monotonously regular rhythms. In my experience, sinus tachycardia rarely looks like the index ECG under discussion, although 'regular', there is usually some variation in heart rate with time. This, of course, does not help us distinguish flutter from other re-entrant narrow complex tachycardias but then why would a 63 year old suddenly develop a paroxysmal SVT such as AVNRT? This brings us neatly onto our penultimate point.
With experience, the complete clinical picture will become more important to you when interpreting the results of most tests in medicine. For example, the fact that the broad complex tachycardia above was recorded in a conscious patient makes VT less likely (though far from impossible). The fact that the index case had no obvious stressor to account for such a dramatic sinus tachycardia etc, etc.

I have come to realise that, like me, the language we use in medicine is from a bygone era. Our terminology is aimed at one another rather than non-medics. The original title of this piece was '10 tips to minimize error'. This is far more attention-grabbing than the title I eventually chose '10 tips to minimize uncertainty'. However, I decided the more dramatic title does us a disservice. In the current climate, we need to avoid describing the sort of difficulties outlined in this article as 'errors' and 'misdiagnoses'. Even the most experienced of doctors and the most powerful of computers struggle to interpret the ECG. The truth is, working in medicine, the only way to consistently avoid 'error' is to consistently avoid taking responsibility.
Note of caution. The 'one fifty rule' refers to the diagnosis of atrial flutter. it has nothing to do with sinus tachycardia. A rate of or higher than 150 beats per minute does not exclude sinus tachycardia. Sinus tachycardia may be as fast as you find it.
DisclaimerPrivacy PolicyTerms of UseData Deletion© Acadoodle 2026